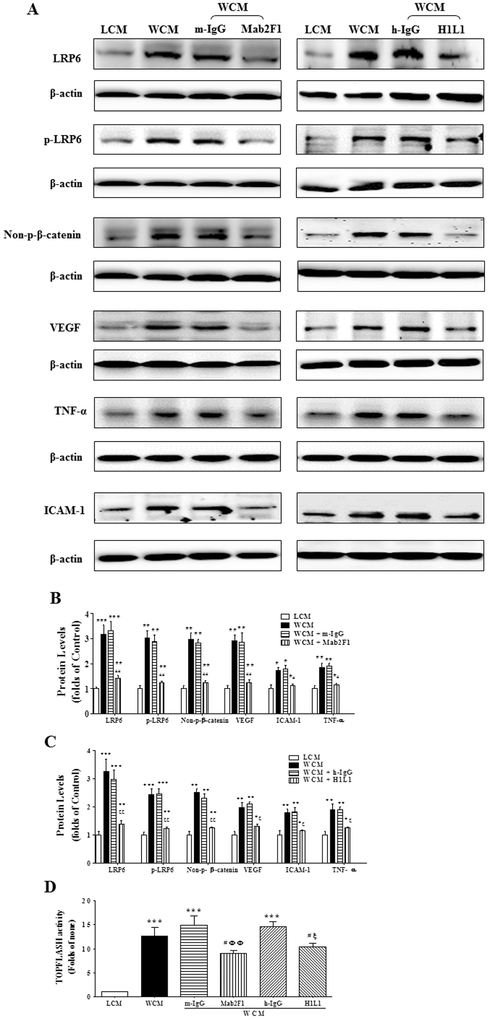
Fig. 4.
Inhibition of Wnt Ligand-induced Activation of Wnt Signaling and over-expression of inflammatory factors by Mab2F1 and H1L1 in human corneal epithelial (HCE) cells. A: HCE cells were pre-treated with or without the Mab2F1, H1L1, mouse IgG (m-IgG) or human IgG (h-IgG) at the concentration of 25 μg mL−1 for 2 h, and then incubated with 10% Wnt3a conditioned medium (WCM), with L cell conditioned medium (LCM) as the controls, for 24 h. Levels of total LRP6, p-LRP6, Non-p-β-catenin, VEGF, TNF-α, and ICAM-1 were measured by Western blot analysis. B & C: The results of Western blotting were semi-quantified by densitometry and normalized to β-actin levels. D: HCE cells were transfected with the TOPFLASH plasmids for 4 h, and then were pre-treated with Mab2F1 or H1L1 at the concentration of 25 μg mL−1, with the same amount of m-IgG and h-IgG as controls for 2 h, and then incubated with 10% WCM, with the LCM as the control, for 16 h. TOPFLASH activity was measured using Luciferase assay and expressed as the firefly/renilla ratio relative to that of LCM. Data were presented as Mean ± SEM (n = 6 per group) and analyzed by Two-way ANOVA, followed by the Bonferroni post hoc analysis to compare the differences between the two groups. ** P < 0.01, versus LCM group; *** P < 0.001, versus LCM group. # P < 0.05, versus WCM group; ## P < 0.01, versus WCM group. ΦΦ P < 0.01, WCM + Mab2F1 versus WCM + m-IgG group. ξ P < 0.05, WCM + H1L1 group versus WCM + h-IgG group; ξξ P < 0.01, WCM + H1L1 group versus WCM + h-IgG group.

