
Figure 3. PTPN2-LysMCre Mice Are Protected from Colitis-Associated Tumor Induction.
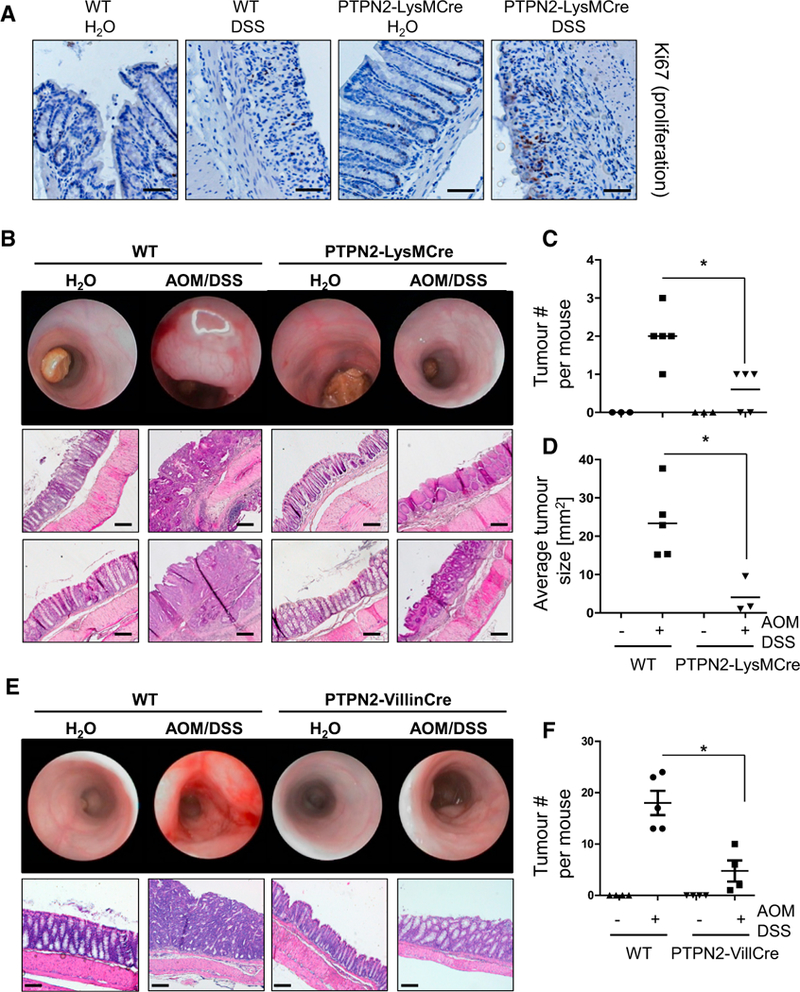
(A) Chronic colitis was induced in WT and PTPN2-LysMCre mice, and sections from the terminal colon were stained for the proliferation marker Ki67.
(B–F) Colitis-associated tumors were induced in WT and PTPN2-LysMCre mice (B–D) or mice lacking PTPN2 in intestinal epithelial cells (PTPN2-VillinCre mice; E and F). Depicted are representative pictures of colonoscopy and histology of the terminal colon (B and E), observed tumor number in dissected colon (C and F), and (D) average tumor size in each mouse.
Data are representative of one of two independent experiments with three to five mice per group. Asterisks denote statistical significance (*p < 0.05; Mann-Whitney U test with Bonferroni correction). Scale bars represent 100 μm. Error bars represent means ± SD. See Figures S4 and S5 for cytokine levels and T cells in PTPN2-LysMCre mice in the DSS and DSS/AOM models.