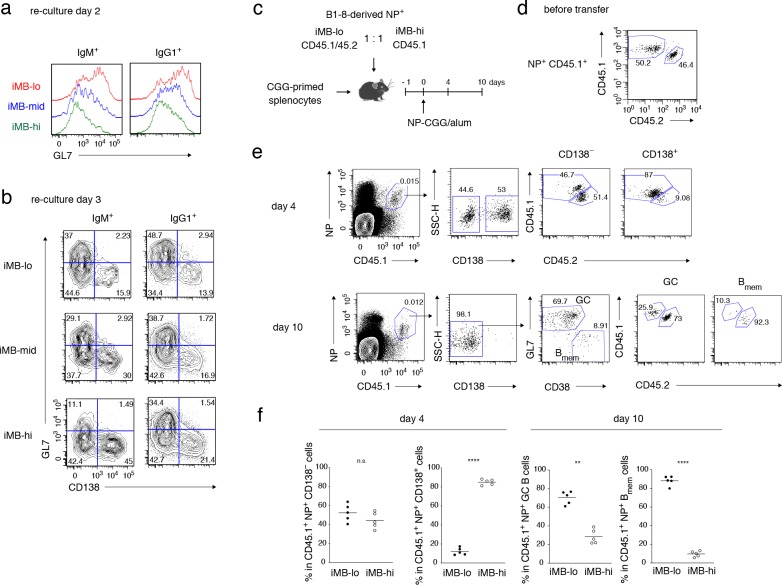
Figure 4. Primary CD40 signaling strength affects secondary Bmem cell differentiation, either to PCs or to GC B cells.
(a, b) Splenic B cells from each recipient mouse (containing iMB cells), generated as in Figure 3 (d), were cultured on 40LB feeder layers with IL-21 for 2 (a) or 3 (b) days. The expression of GL7 (a, b) and CD138 (b) on gated IgM+ or IgG1+ CD45.1+ (iMB cell-derived) cells was analyzed by FCM. (c–f) iMB-lo and iMB-hi cells were generated from B1-8 ki Igκ−/− CD45.1/CD45.2 or B1-8 ki Igκ−/− CD45.1 iGB cells, respectively, as in Figure 3 (d). 2.5 × 10⁴ (for ‘day 4’) or 1 × 10⁴ (for ‘day 10’) of NP+ iMB-lo and iMB-hi cells were mixed and co-transferred into WT B6 recipient mice with 1 × 10⁷ CGG-primed splenocytes. The recipient mice were then immunized with NP-CGG in alum and analyzed 4 or 10 days after immunization. (c) A schematic of the experimental procedure. (d) A representative FCM profile of the mixture of iMB-lo (CD45.2+) and iMB-hi (CD45.2−) cells, gated on CD45.1+ NP+ cells, before the transfer. (e) Representative FCM data at day 4 and day 10 after immunization showing the gating strategy. (f) The frequencies of iMB-lo- and iMB-hi-derived cells among CD45.1+ NP+ CD138− or CD138+ cells at day 4, and among CD45.1+ NP+ Bmem cells (CD138− GL7− CD38+) or GC B cells (CD138− GL7+ CD38−) at day 10. The mean of the values in each group is indicated by a horizontal bar (f). n.s., not significant (p>0.05); **, p<0.01; ****, p<0.0001; as determined by paired Student’s t tests (f). All data are representative of two independent experiments.


