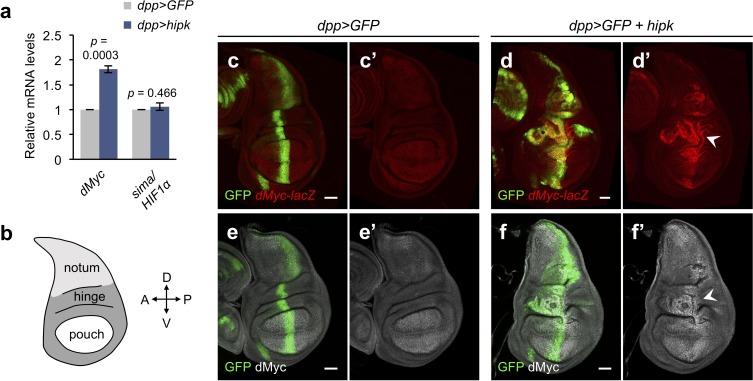
Figure 3. Elevated Hipk drives dMyc upregulation in a region-specific manner.
(a) qRT-PCR analysis of dMyc and sima expression in hipk-expressing discs (dpp>hipk) relative to control discs (dpp>GFP). Data are mean ± sem. n = 3 independent experiments with samples pooled from 10 to 20 wing discs per genotype. Exact p values are shown and calculated using unpaired two-tailed t-test. (b) Schematic diagram of a larval wing imaginal disc, with notum, hinge and pouch in light gray, dark gray and white, respectively. (c–d) β-galactosidase staining (red) in control (dpp>GFP) (c) and hipk-expressing (dpp>GFP + hipk) (d) wing discs harboring a lacZ reporter to monitor the transcriptional induction of dMyc (dMyc-lacZ). White arrowhead in (d’) indicates robust upregulation of dMyc in the wing hinge. (e–f) dMyc staining (gray) in control (dpp>GFP) (e) and hipk-expressing (dpp>GFP + hipk) (f) wing discs. White arrowhead in (f’) indicates dMyc accumulation in the wing hinge. GFP (green) marks the transgene-expressing cells. Scale bars, 50 μm.

