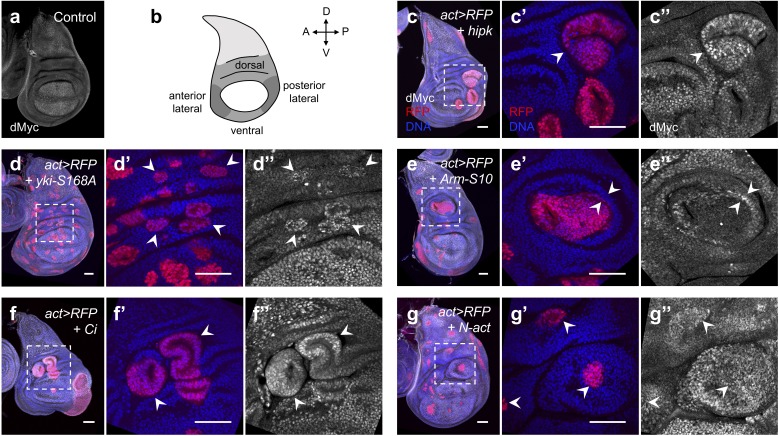
Figure 4. Elevated Hipk and perturbations in cell signaling cascades induce dMyc accumulation in the wing hinge region.
(a) dMyc staining (gray) in a control wing disc. (b) Schematic diagram of a larval wing imaginal disc. The hinge region can be divided into dorsal, lateral and ventral compartments. (c–g) dMyc staining (gray) in flip-out clones expressing hipk (c), yki-S168A (d), Arm-S10 (e), Ci (f) or N-act (g) under the control of actin-Gal4. RFP (red) marks the transgene-expressing clones. DAPI staining for DNA (blue) reveals tissue morphology. (c’, c’’-g’, g’’) are magnified images of the insets (dashed lines) in (c-g). (c) White arrowhead indicates dMyc accumulation in a hipk-expressing clone. (d) White arrowheads indicate yki-S168A-expressing clones with dMyc accumulation. (e) White arrowheads indicate ectopic dMyc expression at the boundary of the Arm-S10-expressing clone and the neighboring wild-type cells. (f) White arrowheads indicate dMyc upregulation in Ci-expressing clones. (g) White arrowheads indicate dMyc accumulation in N-act-expressing clones and the adjacent wild-type cells. Scale bars, 50 μm.


