. 2019 Jul 1;8:e46315. doi: 10.7554/eLife.46315

Figure 6. Pfk2 and Pfk sustain Hipk tumor growth through post-transcriptional regulation of dMyc.

(a–d) dMyc staining (gray in a’’, b’’, c’’ and d’’) in hipk-expressing wing disc (dpp>GFP +  hipk) (a), hipk and pfk2-RNAi co-expressing disc (dpp>GFP + hipk + pfk2-RNAi) (b), hipk and pfk-RNAi co-expressing disc (dpp>GFP + hipk + pfk-RNAi) (c) and hipk and Ldh-RNAi co-expressing disc (dpp>GFP + hipk + Ldh-RNAi) (d). GFP (green) marks the transgene-expressing cells. DAPI staining for DNA (blue) reveals tissue morphology. (e–g) Hipk staining (magenta in e, f and g) and β-galactosidase staining (red in e’, f’ and g’) in hipk-expressing disc (dpp>hipk) (e), hipk and pfk2-RNAi co-expressing disc (dpp>hipk + pfk2-RNAi) (f), hipk and pfk-RNAi co-expressing disc (dpp>hipk +  pfk-RNAi) (g). All wing discs harbor a lacZ reporter to monitor the transcriptional induction of dMyc (dMyc-lacZ). Scale bars, 50 μm.

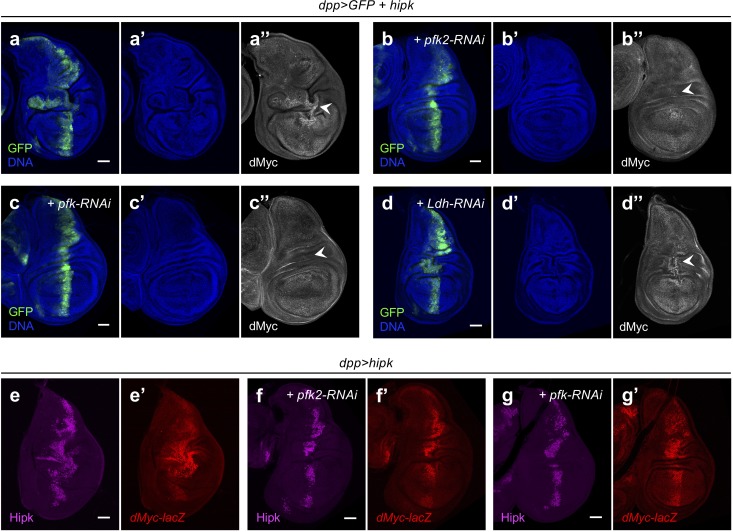
Figure 6—source data 1. Data for pyruvate measurements.
DOI: 10.7554/eLife.46315.021

Figure 6.

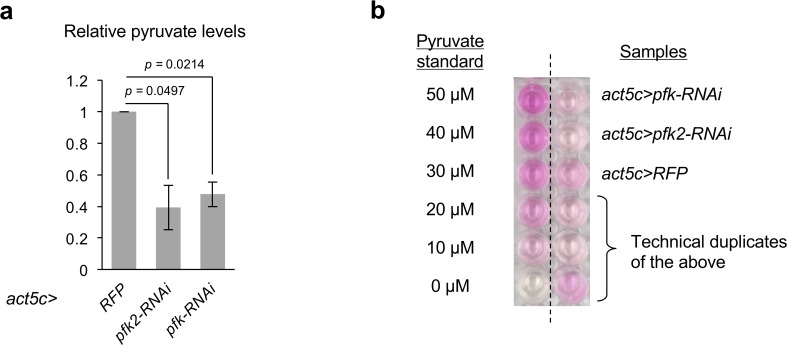
Figure 6—figure supplement 1. Larvae depleted of pfk2 or pfk display decreases in the pyruvate levels.

Figure 6—figure supplement 1.

(a) Relative pyruvate levels in control (act5c>RFP), pfk2 knockdown (act5c>pfk2-RNAi) and pfk knockdown (act5c>pfk-RNAi) larvae. Data are mean ± sem and pooled from two biological replicates. Exact p values are shown and calculated using unpaired two-tailed t-test. (b) The representative result of the colorimetric assay for pyruvate measurement from one set of biological samples. The left column shows the pyruvate standards. The right column shows the biological samples with the indicated genotypes.
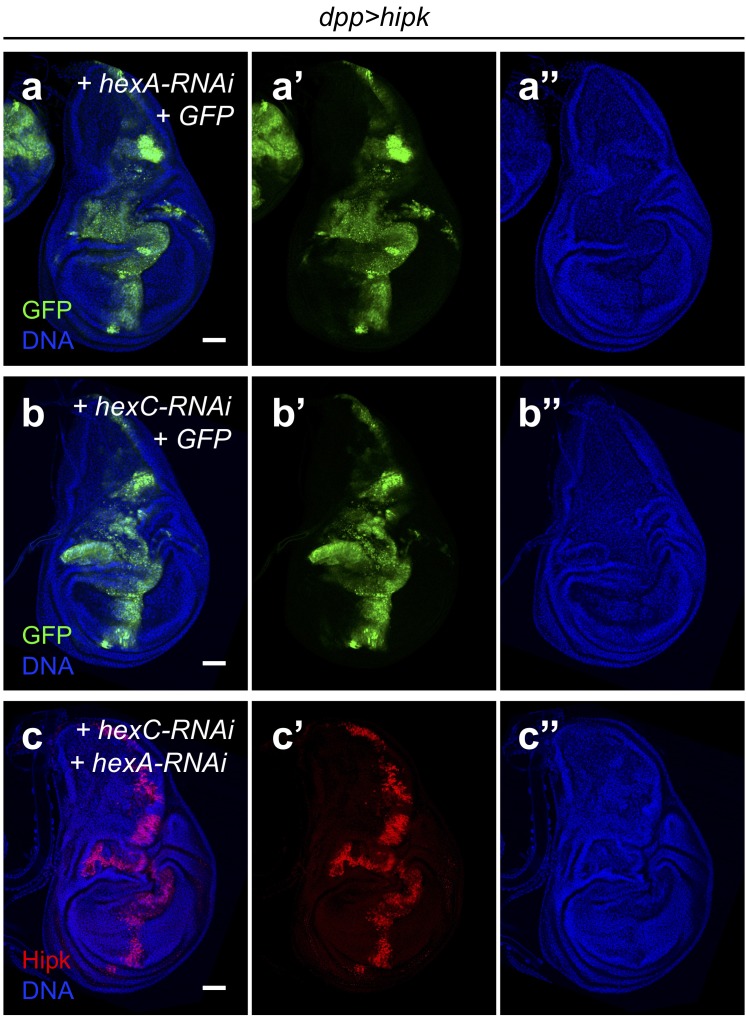
Figure 6—figure supplement 2. Hexokinases are not required for Hipk tumor growth.

Figure 6—figure supplement 2.

(a–b) hipk-expressing wing disc with hex-A knockdown (a) or hex-C knockdown (b). GFP (green) marks the transgene-expressing cells. (c) hipk-expressing wing disc with hex-A and hex-C double knockdown. Hipk staining (red) marks the transgene-expressing cells. DAPI staining for DNA (blue) reveals tissue morphology. Scale bars, 50 μm.
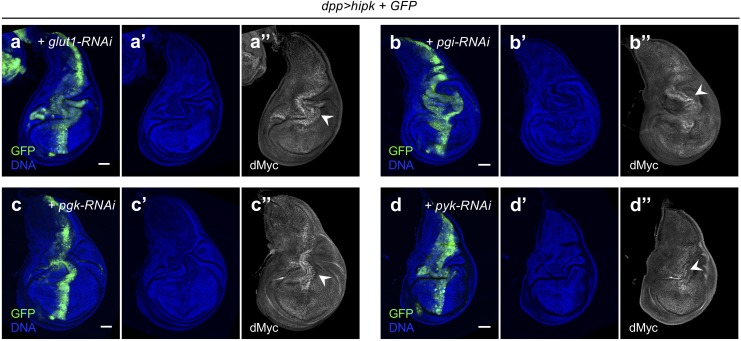
Figure 6—figure supplement 3. Non-targeted inhibition of glycolysis is not sufficient to prevent Hipk tumor growth or ectopic dMyc accumulation.

Figure 6—figure supplement 3.

(a–d) dMyc staining (gray in a’’), (b’’, c’’ and d’’) in hipk and glut1-RNAi co-expressing disc (dpp>GFP + hipk + glut1-RNAi) (a), hipk and pgi-RNAi co-expressing disc (dpp>GFP + hipk + pgi-RNAi) (b), hipk and pgk-RNAi co-expressing disc (dpp>GFP + hipk + pgk-RNAi) (c) and hipk and pyk-RNAi co-expressing disc (dpp>GFP + hipk + pyk-RNAi) (d). GFP (green) marks the transgene-expressing cells. DAPI staining for DNA (blue) reveals tissue morphology. Scale bars, 50 μm.
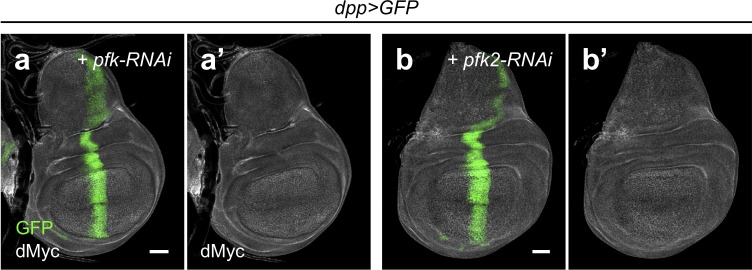
Figure 6—figure supplement 4. Pfk2 and Pfk do not affect dMyc expression in the absence of hipk overexpression.

Figure 6—figure supplement 4.

(a–b) dMyc staining (gray) in pfk knockdown discs (dpp>GFP +  pfk-RNAi) (a) and pfk2 knockdown discs (dpp>GFP + pfk2-RNAi) (b). GFP (green) marks the transgene-expressing cells. Scale bars, 50 μm.
Figure 6—figure supplement 5. Knockdown of pfk2 or pfk does not affect Hipk functions.

Figure 6—figure supplement 5.

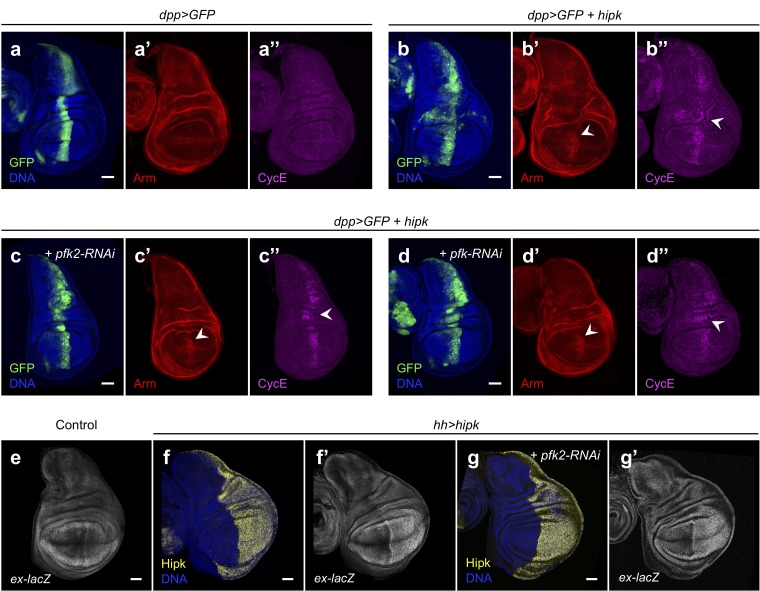
(a–b) Armadillo (Arm, red) and Cyclin E (CycE, magenta) in control discs (dpp>GFP) (a), hipk-expressing discs (dpp>GFP +  hipk) (b), hipk-expressing discs with pfk2 knockdown (dpp>GFP + hipk + pfk2-RNAi) (c), hipk-expressing discs with pfk knockdown (dpp>GFP + hipk + pfk-RNAi) (d). White arrowheads in (b’, c’ and d’) indicate stabilization of Arm in the pouch region. White arrowheads in (b’’, c’’ and d’’) indicate CycE induction along the anterior/posterior boundary of the wing discs. GFP (green) marks the transgene-expressing cells. (e–g) β-galactosidase staining (gray) in control disc (hh-Gal4) (e), hipk-expressing disc (hh>hipk) (f) and hipk-expressing disc with pfk2 knockdown (hh>hipk + pfk2-RNAi) (g). Hh-Gal4 drives transgenic expression in the posterior compartment of wing discs (left half of the discs). All wing discs harboring a lacZ reporter to monitor the transcriptional induction of expanded (ex-lacZ). Hipk staining (yellow) in (f and g) marks the transgene-expressing cells (posterior compartment). Scale bars, 50 μm.