
Figure 3: Chemical networking for discovery of oxylipins.
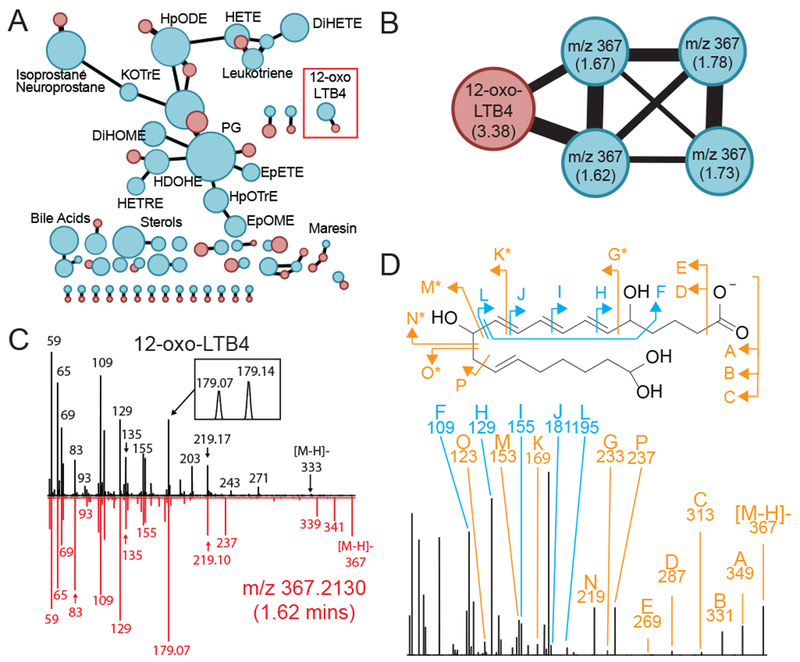
(A) Tandem mass spectra for the 745 chromatographic features matching to chemical formulas of known oxylipins was clustered against tandem mass spectra for the 225 commercial standards with the resulting correlations displayed as a nested molecular network. Here, red nodes indicate tandem mass spectra for commercial standards with blue nodes indicating tandem mass spectra from the 745 unknown compounds, with the size of the nodes reflecting number of unique spectra contained within each node. (B) Expanded view of the 12-oxo-LTB4 node (red box from 3A) showing the observed m/z and retention time in minutes within parenthesis. (C) Overlay of tandem mass spectra from 12-oxo-LTB4 and m/z 367 at 1.62 minutes showing high degree of similarity. (D) Manual annotation of spectral fragments of m/z 367 at 1.62 minutes and how they relate to the structure of 12-oxo-LTB4 with blue arrows indicating identical fragments and orange arrows indicating a shift of +CH4O between carbons 11 and 13. See also Data S-1.