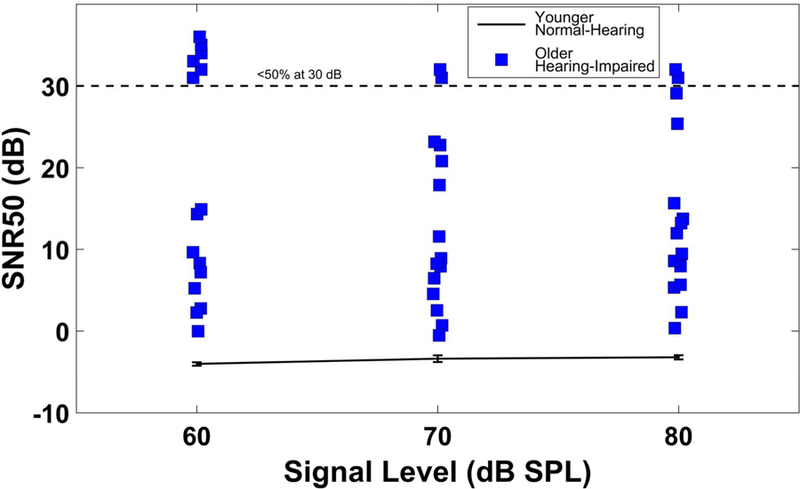
Figure 2.

Variability in speech understanding in noise across listeners. SNR50s are plotted for different signal levels for a young, normal-hearing group (error bars show ±1 standard error of the mean) and for older hearing-impaired individuals. Points above the dashed line represent those individuals who remained below 50% performance at the maximum test SNR of 30 dB.
