Figure 3.

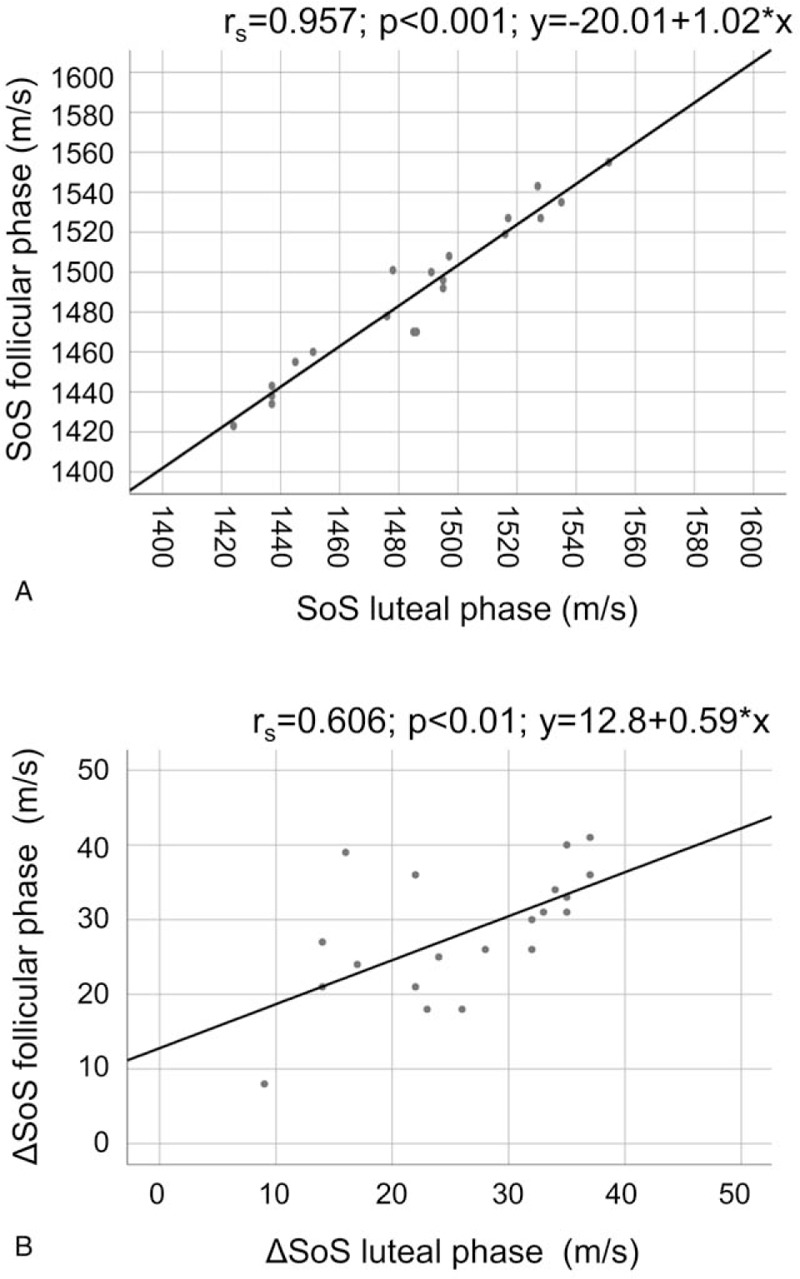
Correlation of SoS (A) and ΔSoS (B) measurements of the follicular (n = 20) and luteal phases (n = 20) (average measurements of both breasts).

Correlation of SoS (A) and ΔSoS (B) measurements of the follicular (n = 20) and luteal phases (n = 20) (average measurements of both breasts).