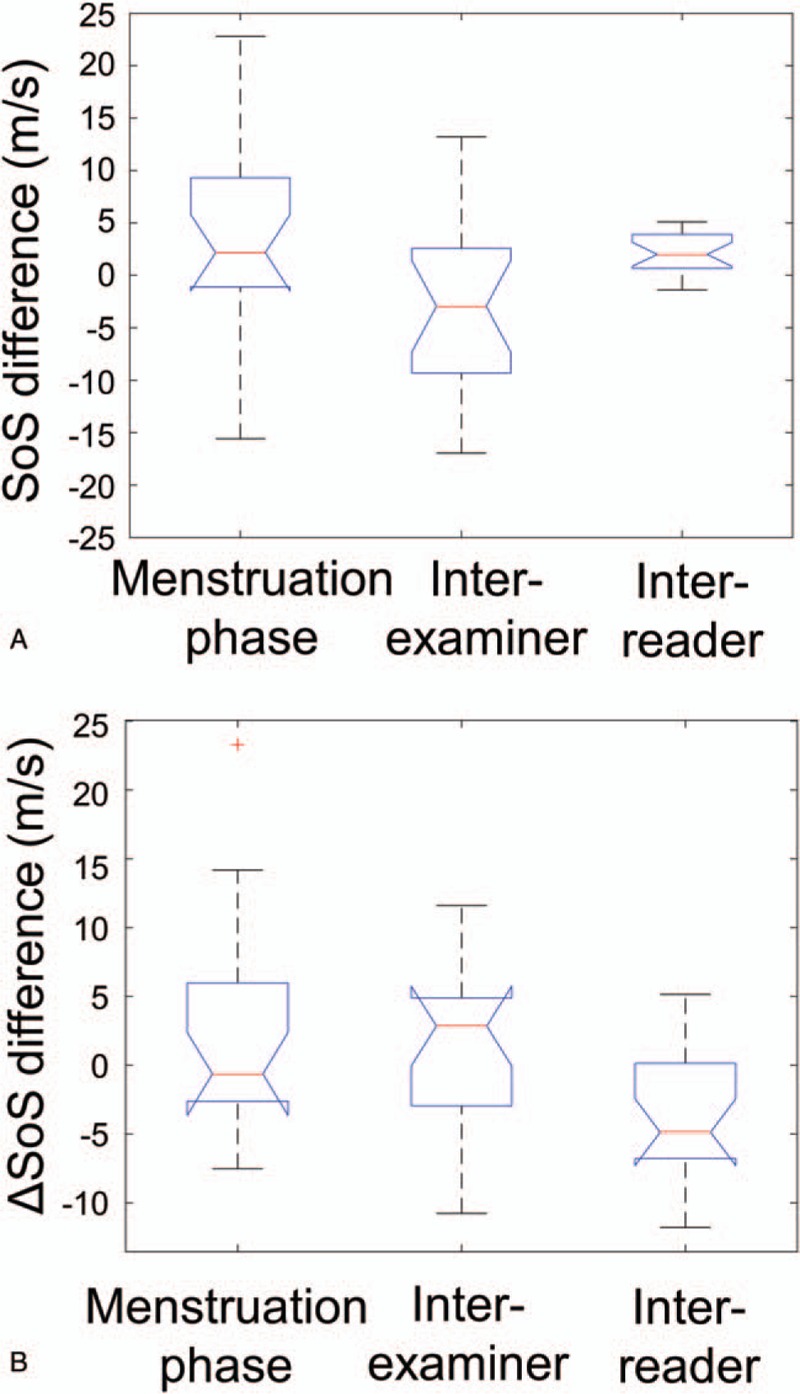
Figure 7.

Boxplots of uncertainties between SoS (A) and ΔSoS (B) measurements performed at left: different menstruation phases (luteal/follicular), center: by different examiners, and right: annotated by different readers. Average measurements of both breasts are plotted.
