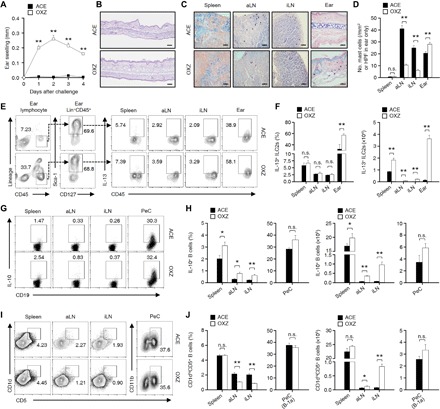
Fig. 1. Population alterations of MCs, ILC2s, and IL-10+ Breg cells in CHS mice.

(A) Data for the ear thickness of CHS mice for 4 days after challenge with OXZ are shown. (B) Two days after OXZ challenge, representative histology images of ear tissues [hematoxylin and eosin (H&E); scale bars, 200 μm] are shown. (C) Two days after OXZ challenge, representative MC images in spleen, aLN, iLN (scale bars, 50 μm), and ear tissues [high-power field (HPF); scale bar, 100 μm] with toluidine blue are shown, and (D) the histograms show the number of MCs in spleen, aLN, iLN, and ear tissues. (A to D) The results are expressed as the mean ± SEM (A and D) or representative images (B and C) from three independent experiments (n = 5 per group for each experiment). **P < 0.01; n.s., not significant versus ACE-treated mice by Student’s t test. (E) Representative plot images show IL-13+Lin−CD45+CD127+Sca-1+ cells (IL-13+ ILC2s) in spleen, aLN, iLN, and ear. (F) The histograms show the frequencies and numbers of IL-13+ ILC2s for (E). (G) Representative flow cytometry images are shown for IL-10+CD19+ B cells or (I) CD1dhiCD5+CD19+ B cells in the spleen, aLN, and iLN or CD5+CD11b+CD19+ B cells in the PeC. (H) Frequencies and numbers are shown for (G) and (J) for (I). (E to J) The results are expressed as representative images (E, G, and I) or the mean ± SEM (F, H, and J) from two independent experiments (n = 5 per group for each experiment). *P < 0.05; **P < 0.01; n.s., not significant versus acetone (ACE)–treated mice by Student’s t test.
