
Fig. 2. Breg cells suppress IL-13+ ILC2s in an IL-10–dependent manner.
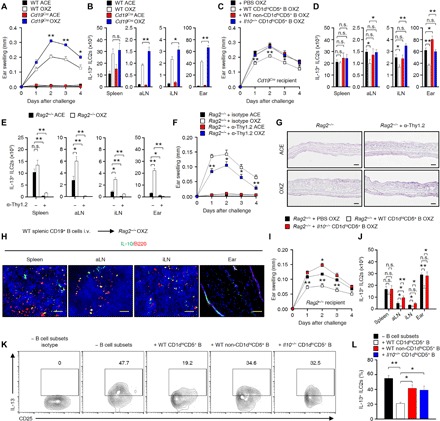
(A) Data for the ear thickness of WT or Cd19Cre mice with CHS for 4 days after challenge with OXZ are shown. (B) The histograms show the numbers of IL-13+ ILC2s isolated from the spleen, aLN, iLN, and ear tissue 2 days after the OXZ challenge. (C) Data for the ear thickness and (D) the number of IL-13+ ILC2s in Cd19Cre mice with CHS are shown after the adoptive transfer of OXZ-sensitized WT or Il10−/− B cell subsets as indicated. (A to D) The results are expressed as the mean ± SEM from two independent experiments (n = 5 per group for each experiment). *P < 0.05; **P < 0.01; n.s., not significant by Student’s t test (A to C) or one-way analysis of variance (ANOVA) with post hoc Tukey’s test (D). (E to G) The histograms for (E) the number of tissue IL-13+ ILC2s, (F) the ear thickness, and (G) the histology images of ear tissues (2 days after OXZ challenge; scale bars, 200 μm) in CHS Rag2−/− mice with or without anti-Thy1.2 mAb treatment are shown. The results are expressed as the mean ± SEM from two independent experiments (n = 4 per group for each experiment). *P < 0.05; **P < 0.01; n.s., not significant versus Rag2−/− + isotype OXZ by Student’s t test. (H) After the adoptive transfer of WT splenic CD19+ B cells into Rag2−/− mice, CHS was induced by OXZ challenge. Representative immunofluorescence images of IL-10 (green) and B220 (red) are shown (n = 5; scale bars, 100 μm). (I) Ear thicknesses and (J) IL-13+ ILC2 numbers in CHS Rag2−/− mice with or without the transfer of WT or Il10−/− CD1dhiCD5+ B cell subsets. (K) Representative flow cytometry images for IL-13+ ILC2s in coculture with WT CD1dhiCD5+, WT non-CD1dhiCD5+, or Il10−/− CD1dhiCD5+ B cell subsets at a 1:1 ratio and (L) frequency data are shown. (I to L) The results are expressed as the mean ± SEM (I, J, and L) or representative images (K) from two independent experiments (n ≥ 3 per group for each experiment). *P < 0.05; **P < 0.01; n.s., not significant by Student’s t test (I) or one-way ANOVA with post hoc Tukey’s test (J and L).