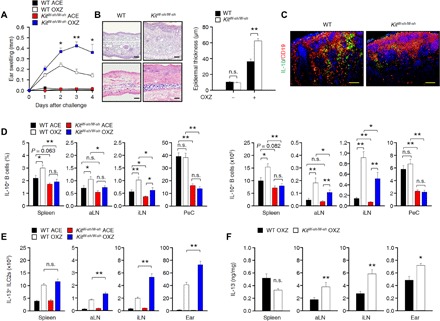
Fig. 3. MCs are critical for the maintenance of IL-10+ Breg cells and the inhibition of IL-13+ ILC2s in peripheral tissues.

(A) Ear thickness is shown for 4 days after challenge with OXZ in WT or KitW-sh/W-sh mice. (B) Representative images (2 days after OXZ challenge) after staining with H&E (top) or toluidine blue (bottom) of ear tissues (scale bars, 100 μm) and histograms of ear epidermal thickness are shown. (A and B) Data are expressed as the mean ± SEM from three independent experiments (n ≥ 4 per group for each experiment). *P < 0.05; **P < 0.01; n.s., not significant by Student’s t test. (C) Representative immunofluorescence images of IL-10+ Breg cells in the draining LNs from WT and KitW-sh/W-sh mice are shown (IL-10, green; CD19, red) (n = 5; scale bars, 50 μm). (D to F) The results from tissues of WT or KitW-sh/W-sh mice 4 days after challenge with OXZ are shown. (D) The histograms show the frequencies (left) and numbers (right) of IL-10+ Breg cells. (E) The histograms show the numbers of IL-13+ ILC2s. (F) The histograms show the amount of IL-13 by enzyme-linked immunosorbent assay (ELISA). (D to F) Data are expressed as the mean ± SEM from two independent experiments (n ≥ 3 per group for each experiment). *P < 0.05; **P < 0.01; n.s., not significant by one-way ANOVA with post hoc Tukey’s test.
