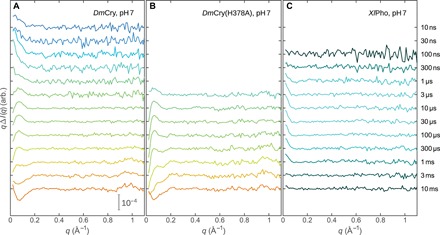
Fig. 2. TRXSS data.

TRXSS data covering delay times from 10 ns to 10 ms for wild-type DmCry (A), for the DmCry(H378A) mutant (B), and for XlPho (C). Coloring follows the transient population of the different intermediates shown in Fig. 3. Different delay time ranges were probed for the samples because of restrictions in beamtime and available sample volumes.
