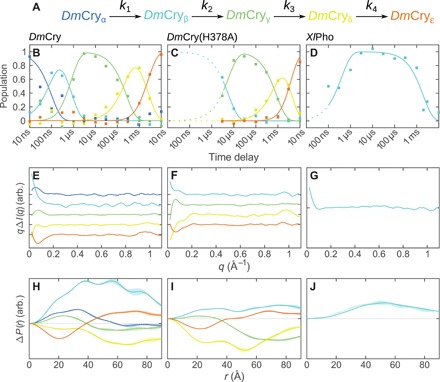
Fig. 3. Kinetic analysis of TRXSS data.

(A) The kinetic model used for the analysis of the TRXSS data. Time-dependent populations of the different structural intermediates are shown in (B) to (D) for DmCry wild type (B), DmCry(H378A) (C), and XlPho (D). The fitted model is shown as lines. The squares represent the optimized populations obtained by fitting the experimental difference scattering curves with the species-associated difference scattering curves in (E) to (G). The model outside the probed time region is shown as dotted lines. Species-associated difference scattering curves for DmCry (E), DmCry(H378A) (F), and XlPho (G). Change in the pair distance distribution [P(r)] for DmCry (H), DmCry(H378A) (I), and XlPho (J). The shaded area represents ± 1 SD. The first intermediate state of DmCry(H378A) is not well resolved because of the limited time range probed and appears to be a mixture of DmCryα and DmCryβ.
