
Fig. 5. Profiling of Kac, Ksucc, and Khib in P. mirabilis.
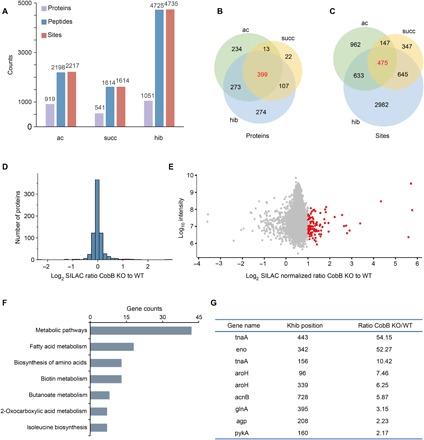
(A) Statistical analysis of the Kac, Ksucc, and Khib proteins, peptides, and sites. (B) Statistical analysis of the common acylated proteins. (C) Statistical analysis of the common acylated sites. (D) The histograms show experimentally determined relative protein abundance distributions for the samples used to analyze 2-hydroxyisobutyrylation. (E) The scatterplots show the ratio of Khib peptides in CobB KO versus WT E. coli cells in relation to average peptide intensities. (F) The bar graph shows pathways enriched in CobB-regulated Khib proteomes. (G) The list shows the carbon metabolic enzymes with a significant up-regulation of the Khib level under CobB KO conditions.