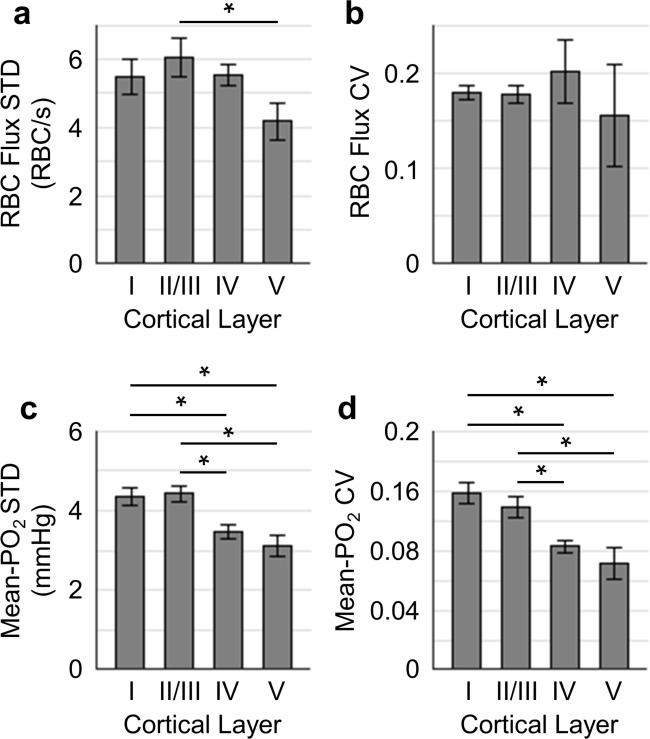
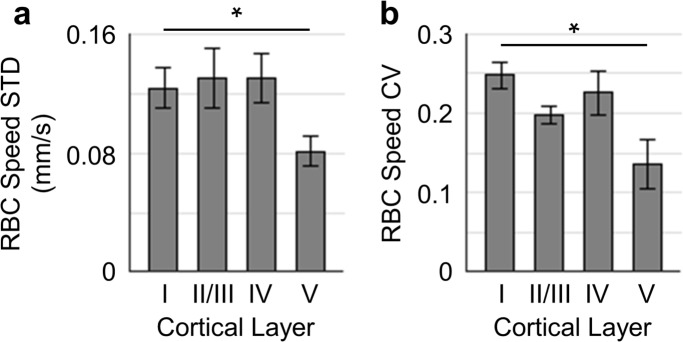
Figure 4. Temporal fluctuations of RBC flux and Mean-PO2 within individual capillaries in cortical layers I-V.
Panels (a–b) and (c–d) show the layer-dependent standard deviations (STDs) and coefficients of variance (CVs) of the temporal fluctuations of RBC flux and Mean-PO2, respectively. The STD and CV of each observable for each capillary were calculated based on the 9-s-long time course. The analysis in (a–d) was made with 130, 140, 63 and 40 samples, collected in cortical layers I, II/III, IV and V, respectively, across n = 7 mice. Each sample corresponds to a 9-s-long, 15-time-point measurement acquired in each capillary. Data are expressed as mean ± SEM. Statistical comparisons were carried out using ANOVA followed by Tukey HSD post hoc test. The asterisk symbol (*) indicates p<0.05.


