. 2019 Jul 15;8:e42299. doi: 10.7554/eLife.42299

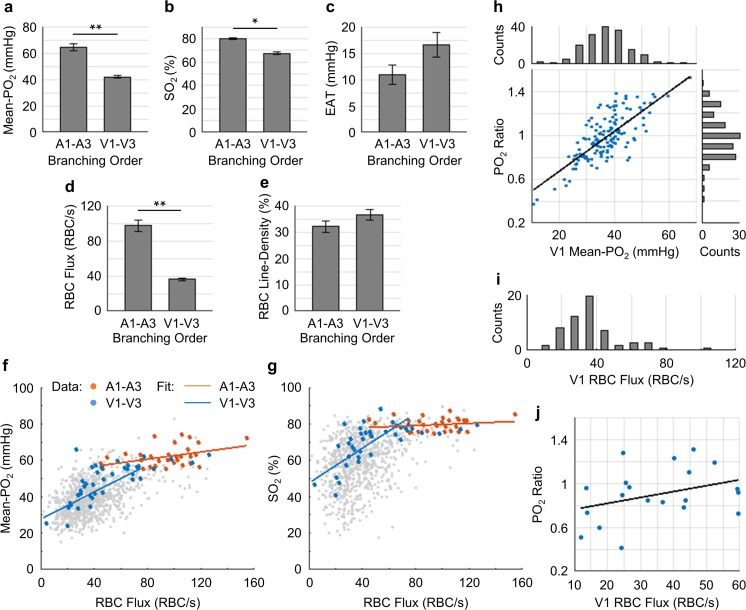
Figure 7. Capillary flow and oxygenation in the upstream and downstream branches.

(a-e) Average capillary Mean-PO2, SO2, EAT, RBC flux and line-density, in the upstream (A1–A3) and downstream (V1–V3) capillary branches, across cortical layers I-III. Data are expressed as mean ± SEM. Statistical comparisons were carried out using Student’s t-test. The single-asterisk symbol (*) indicates p<0.05; the double-asterisk symbol (**) indicates p<0.001. (f and g) Correlations between capillary RBC flux and Mean-PO2 (f) and SO2 (g). Data points and regression lines from the A1-A3, V1-V3, and all capillary segments (branching order unassigned) are color-coded red, blue, and gray, respectively. Linear regression slopes in f: V1-V3 slope = 0.37 mmHg∙s∙RBC−1 (R2 = 0.61), A1-A3 slope = 0.1 mmHg∙s∙RBC−1 (R2 ≈ 0.17). Linear regression slopes in g: V1-V3 slope = 0.50 s∙RBC−1 (R2 = 0.52), A1-A3 slope = 0.03 s∙RBC−1 (R2≈0.04). The analysis in a–g was made with 47 upstream and 50 downstream capillaries, across n = 5 mice. (h) Correlation between the PO2 ratio (the V1 capillary Mean-PO2 to the adjacent PCV PO2) and the V1 capillary Mean-PO2. Histograms of the V1 capillary Mean-PO2, and PO2 ratio are at the top and on the right from the main panel, respectively (178 capillaries, across n = 5 mice). (i) Histogram of the V1 capillary RBC flux (65 capillaries, across n = 5 mice). (j) Correlation between the V1 capillary RBC flux and PO2 ratio (20 capillaries, across n = 5 mice). The linear regression slope = 0.01 s∙RBC−1 (R2≈0.12).

Figure 7.

Figure 7—figure supplement 1. Average capillary RBC speed in the upstream (A1–A3) and downstream (V1–V3) capillary branches, across cortical layers I-III.

Figure 7—figure supplement 1.

Data are expressed as mean ± SEM. Statistical comparisons were carried out using Student’s t-test. The double-asterisk symbol (**) indicates p<0.001. This analysis was made with 47 upstream and 50 downstream capillaries, across n = 5 mice.
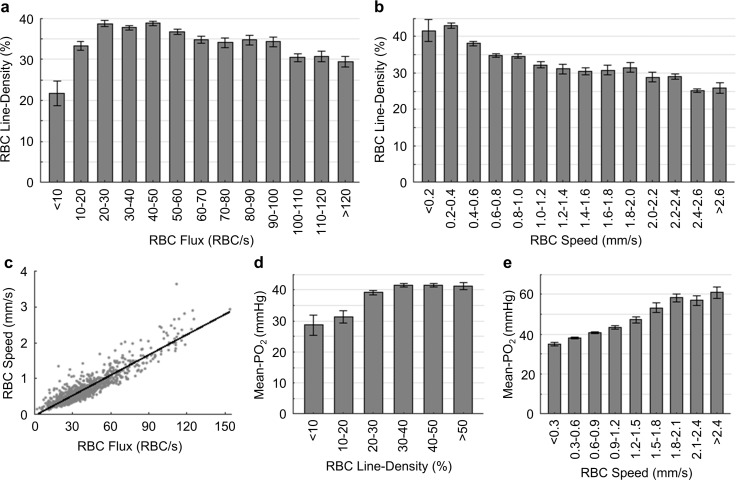
Figure 7—figure supplement 2. Pairwise relations between capillary RBC flux, speed, line-density and Mean-PO2.

Figure 7—figure supplement 2.

The analysis in (a–e) was made with the measurements from 978 capillary segments collected in cortical layers I-V, across n = 15 mice. Data are expressed as mean ± SEM. In (c), the slope of the linear regression line was calculated as ~0.02 mm/RBC (R2 =~ 0.84).
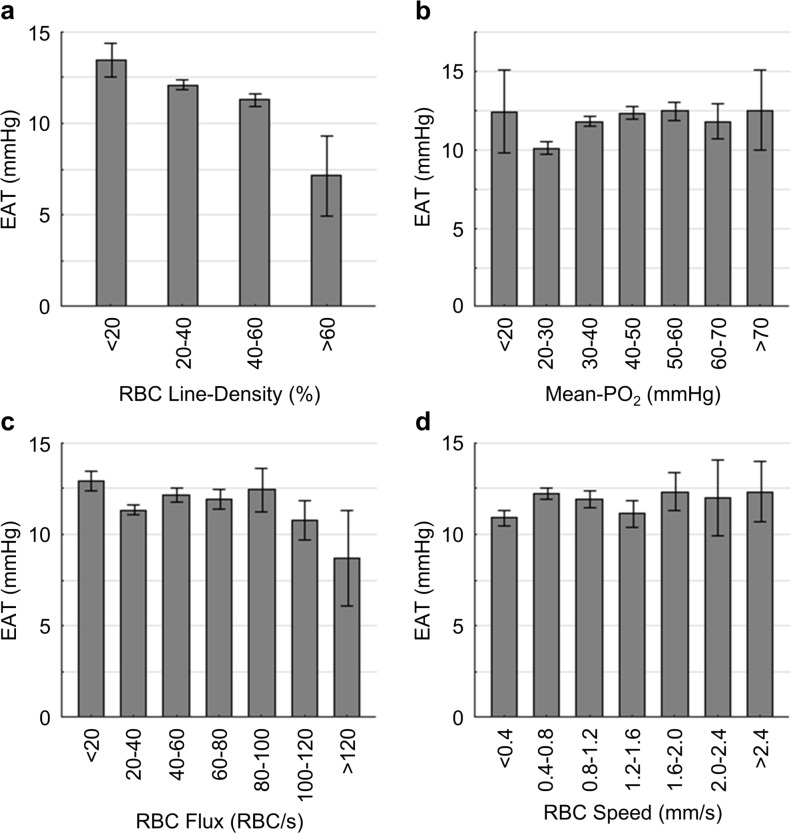
Figure 7—figure supplement 3. Relations between capillary RBC line-density, Mean-PO2, flux, speed and EAT.

Figure 7—figure supplement 3.

The analysis in (a–d) was made with the measurements from 373 capillary segments collected in cortical layers I-V, across n = 7 mice. Data are expressed as mean ± SEM.
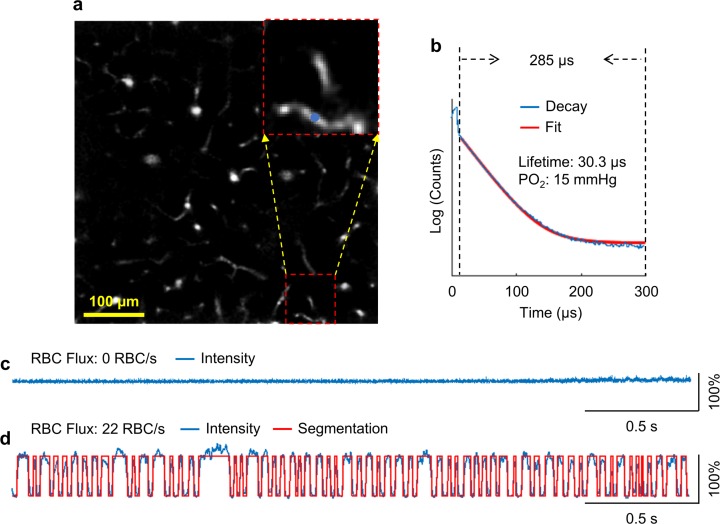
Figure 7—figure supplement 4. Identification of a capillary segment having stalled RBC flow.

Figure 7—figure supplement 4.

(a) A Sulforhodamine-B labeled mouse cortical microvasculature. The enlarged image includes the stalled capillary segment. The PO2 measurement was performed on the location denoted by the blue dot. (b) The average phosphorescence decay recorded on the measurement location in a. The 285-µs-long phosphorescence decay was used to calculate the phosphorescence lifetime. (c) The associated phosphorescence intensity time course (3 s trace) acquired on the measurement location in a. d. A phosphorescence intensity time course (3 s trace) acquired in an arbitrary non-stalled capillary segment as a comparison.
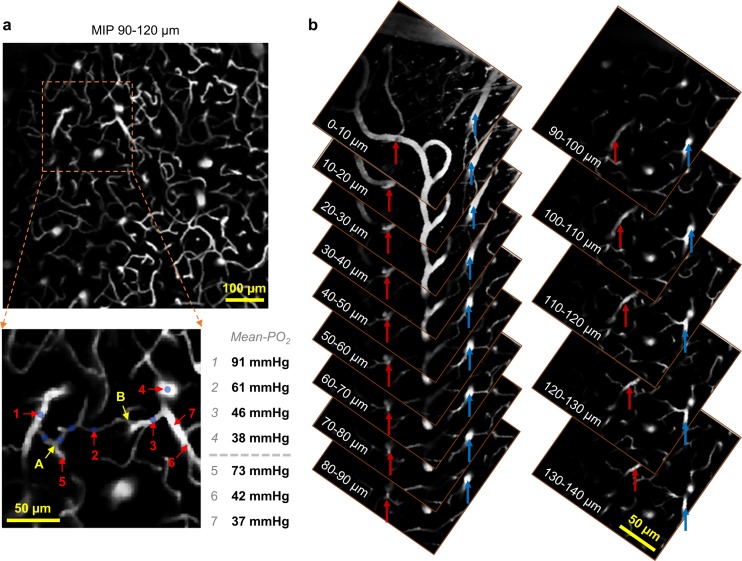
Figure 7—figure supplement 5. Identification of a suspected thoroughfare capillary.

Figure 7—figure supplement 5.

(a) Upper panel: The maximum intensity projection of the vasculature stack (90–120 µm under cortical surface). Lower panel: The enlarged image includes the vascular paths of the suspected thoroughfare capillary. PO2 measurements were performed on the segments labeled with numbers, and their values are shown next to the vascular image. (b) Tracking of the arteriole (#1 in the lower panel in a) indicated by the red arrow and the venule (#4 in the lower panel in a) indicated by the blue arrow, from the cortical depth of 140 μm to the cortical surface. The maximum intensity projection of the Sulforhodamine-B labeled microvascular stack (cortical depth: 90–120 µm) is shown in the upper panel in a). The enlarged image (lower panel in a) includes the vascular paths of the suspected thoroughfare capillary. The vessel types of the vascular segments #1 and #4 were identified as arteriole and venule, respectively, based on their PO2 values and the morphologies of their parent vessels by tracking them with the three-dimensional angiogram to the cortical surface. The complete vascular path, starting from the arteriole (#1) to the venule (#4), consists of the vascular segments marked by the blue dots. PO2 measurements were performed on the locations labeled with numbers, and their PO2 values are shown at right. The three vascular segments from A to B were identified as capillaries, based on their diameters. The Mean-PO2 of the pre-venule capillary (#2) was calculated to be 61 mmHg, much higher than the average capillary Mean-PO2 (45.6 ± 1.4 mmHg; Figure 1—figure supplement 2a). In addition, the vascular path from A to B consists of only three segments; and the physical length from A to B was estimated to be 85 µm. Therefore, this vascular path (A–B) is short in both number of capillary segments and physical length. We thus suspect that the capillary segment #2 is a thoroughfare channel that transported the highly oxygenated blood back to the venule, contributing to the increase in the venous oxygenation towards brain surface.