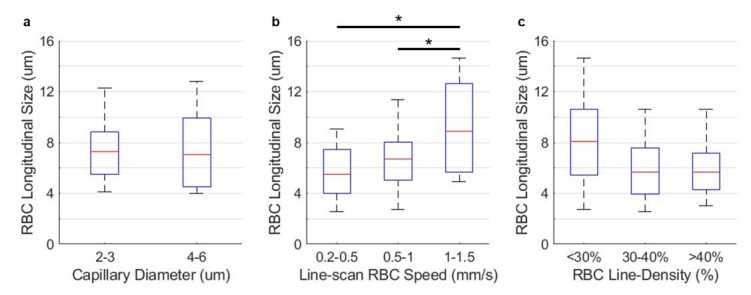
Author response image 1. RBC longitudinal size vs. capillary diameter, RBC speed, and line-density, respectively.

The measurements were performed in 58 capillaries in two awake mice, within the cortical depth of 0-200 µm. The statistical comparison in panel a was carried out using Student’s t-test. The statistical comparisons in panels b-c were carried out using ANOVA followed by a Tukey-HSD post-hoc test. The asterisk symbol indicates P<0.05.
