. 2019 Jul 2;8:e45068. doi: 10.7554/eLife.45068

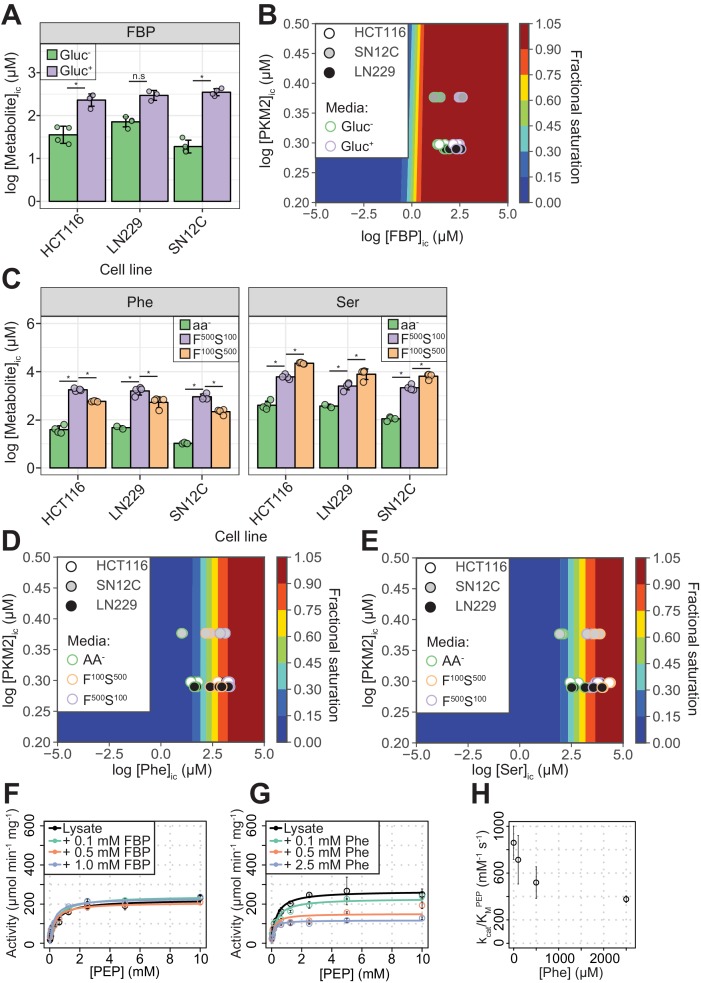
Figure 2. PKM2 allosteric effector concentrations in cells predict saturating binding of FBP and sub-saturating binding of Phe and Ser.

(A) Intracellular concentrations of FBP ([FBP]ic) measured using liquid-chromatography mass spectrometry (LC-MS), from HCT116 (colorectal carcinoma), LN229 (glioblastoma) and SN12C (renal cell carcinoma) cells cultured in RPMI media containing 11 mM glucose (Gluc+), or 0 mM (Gluc) for 1 hr. Statistical significance was assessed using a Wilcoxon rank-sum test. Asterisk (*) marks significant changes (p-value<0.05). (B) Phase diagram for intracellular FBP binding to PKM2 computed for a range of [FBP] and [PKM2] values using 174 nM as the upper-limit estimate of the KDFBP, obtained as shown in Figure 2—figure supplement 2. Colour scale represents fractional saturation of PKM2 with ligand. A fractional saturation of 0 indicates no FBP bound to PKM2 and a fractional saturation equal to one indicates that each FBP binding site in the cellular pool of PKM2 would be occupied. Experimental fractional saturation values were estimated from [FBP]ic obtained from (A) and [PKM2]ic was determined using targeted proteomics (see Materials and methods and Supplementary file 1). The predicted fractional saturation for each of the three cell lines (four technical replicates) is shown as shaded open circles in the phase diagram. (C) Intracellular concentrations of Phe ([Phe]ic) and Ser ([Ser]ic) measured as in (A), in HCT116, LN229 and SN12C cells cultured in Hank’s Balanced Salt Solution (HBSS) without amino acids (aa-), HBSS containing 100 µM Phe and 500 µM Ser (F100 S500), or HBSS containing 500 µM Phe and 100 µM Ser (F500 S100). The low concentrations of Phe and Ser are similar to human serum concentrations (Tardito et al., 2015). [Phe]ic and [Ser]ic were not affected by extracellular glucose concentration (Figure 2—figure supplement 4A), neither did extracellular Phe and Ser concentrations influence [FBP]ic (Figure 2—figure supplement 4B). Statistical significance was assessed as in (A). (D) Phase diagram for Phe computed as in (B) using [Phe]ic from (C). (E) Phase diagram for Ser computed as in (B) using [Ser]ic from (C). (F) PKM2 activity in lysates of HCT116 cells cultured in RPMI (Gluc+). Measurements were repeated following the addition of either 0.1, 0.5 or 1.0 mM of exogenous FBP. Initial velocity curves were fitted using Michaelis-Menten kinetics and the absolute concentration of PKM2 in the lysates was estimated using quantitative Western blotting (Figure 2—figure supplement 5B), to calculate PKM2 specific activity. (G) PKM2 activity in HCT116 cell lysates as in (F), but with addition of exogenous Phe. (H) Plot of kcat/KM versus [Phe] from (G) revealing a dose-dependent inhibitory effect of Phe on the activity of PKM2 in HCT116 lysates.

Figure 2.

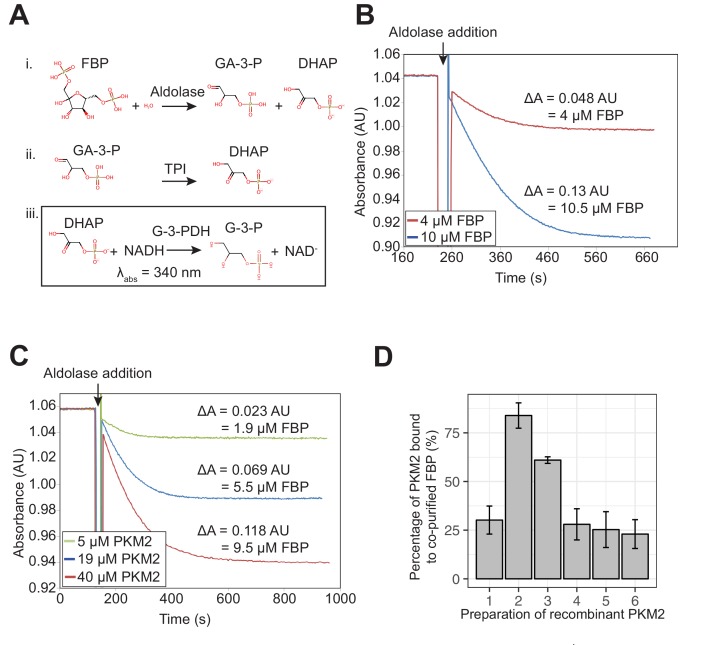
Figure 2—figure supplement 1. Detection of residual FBP in purified recombinant PKM2 preparations.

Figure 2—figure supplement 1.

(A) FBP co-purified with recombinant PKM2 was quantified using a spectrophotometric coupled-enzyme assay that employs aldolase, triose phosphate isomerase (TPI) and glycerol-3-phosphate dehydrogenase (G-3-PDH). The final step of the three-enzyme reaction involves the oxidation of NADH, leading to a decrease in absorbance at 340 nm. (B) The aldolase coupled assay in (A) can reliably detect as low as 4 µM FBP. Sensitivity of the aldolase assay was tested by adding 4 or 10 µM purified FBP, and oxidation of NADH was initiated by adding the aldolase enzyme following an equilibration period. Amount of FBP was calculated from the measured decrease in the amount of NADH (one molecule of FBP consumed for every two molecules of NADH oxidised). (C) Levels of FBP detected in increasing amounts of recombinant PKM2. Indicated amounts of purified PKM2 were heat-precipitated at 95°C to release any co-purified FBP and the supernatant was used for FBP quantification with the aldolase assay as in (A). (D) Amounts of FBP quantified, as in (A), for six independent preparations of purified recombinant PKM2. The amounts of co-purified FBP are represented as a proportion of the amount of recombinant PKM2. Preparations of PKM2 determined to have < 25% co-purifying FBP were used throughout this study.
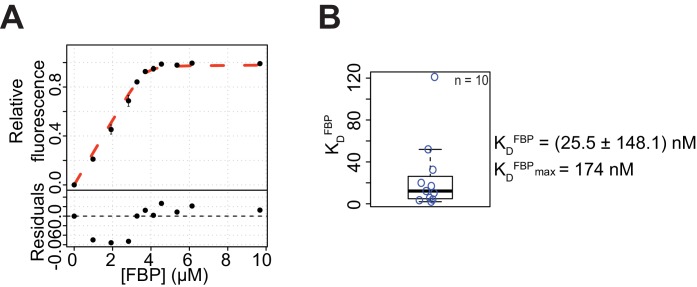
Figure 2—figure supplement 2. FBP binds to PKM2 with nM affinity.

Figure 2—figure supplement 2.

(A) A representative curve of FBP binding to PKM2, derived from measuring fluorescence (λEX = 280 nm, λEM = 290–450 nm) of PKM2 tryptophan residues (two of which are proximal to the FBP binding pocket) at different FBP concentrations. The apparent binding constant (KDFBP) was estimated from a 1:1 binding model, fit to the experimental data (dashed red line) using a non-linear least-squares fitting procedure (see Materials and methods). The average measurements and standard deviations from four independent experiments are shown. (B) The average KDFBP = (25.5 ± 148.1) nM (KDFBP upper limit = 174 nM) calculated from ten replicate titration measurements as in (A). The large error in the affinity estimate was due to the high concentration of PKM2 (5 µM), relative to the apparent KDFBP, that was necessarily used to monitor intrinsic PKM2 fluorescence changes upon FBP addition (see Materials and methods for details).
Figure 2—figure supplement 3. Affinities of Phe and Ser for PKM2.
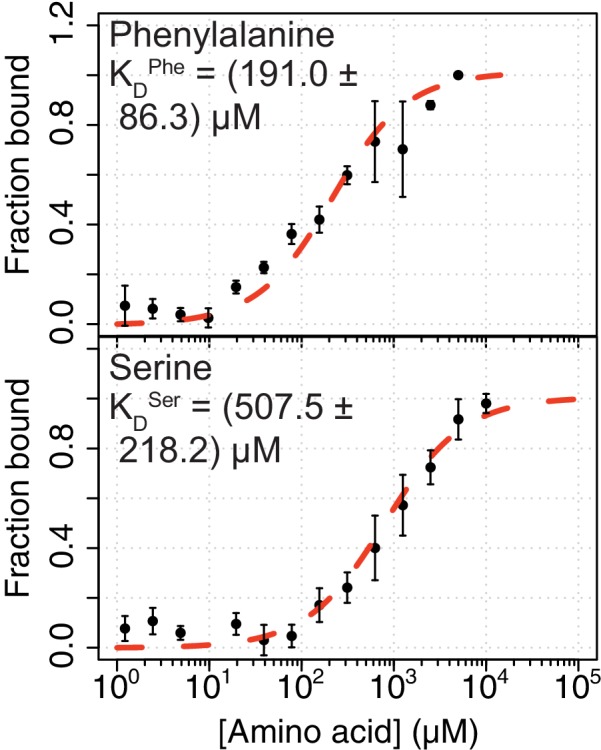
Figure 2—figure supplement 3.

Affinity of Phe and Ser for PKM2 determined using microscale thermophoresis (MST) measurements of fluorescein-labelled PKM2 (30 nM). Indicated binding affinities were estimated using a 1:1 binding model. The average measurements and standard deviations from four independent experiments are shown.
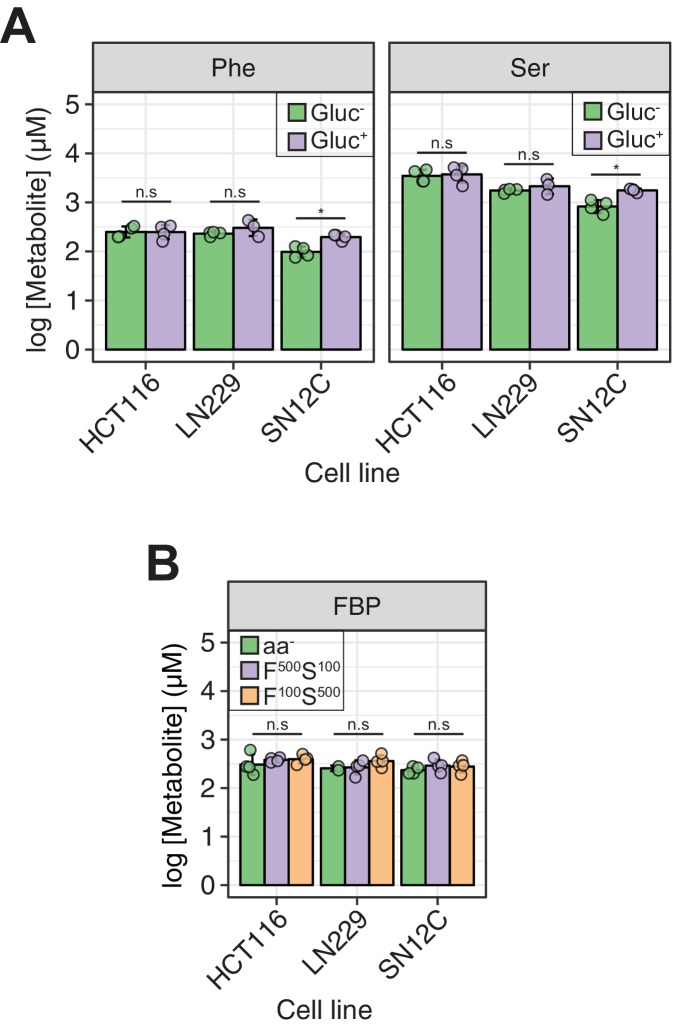
Figure 2—figure supplement 4. Acute (1 hr) modulation of glucose and Phe/Ser concentration in the media does not affect intracellular concentrations of Phe/Ser or FBP, respectively.

Figure 2—figure supplement 4.

(A) [Phe]ic and [Ser]ic in cells as in Figure 2A showing no significant changes upon changes of glucose concentration in media. Statistical significance determined as in Figure 2A. (B) [FBP]ic in cells as in Figure 2C showing no significant changes depending on Ser or Phe concentration in HBSS. Statistical significance determined as in Figure 2A.
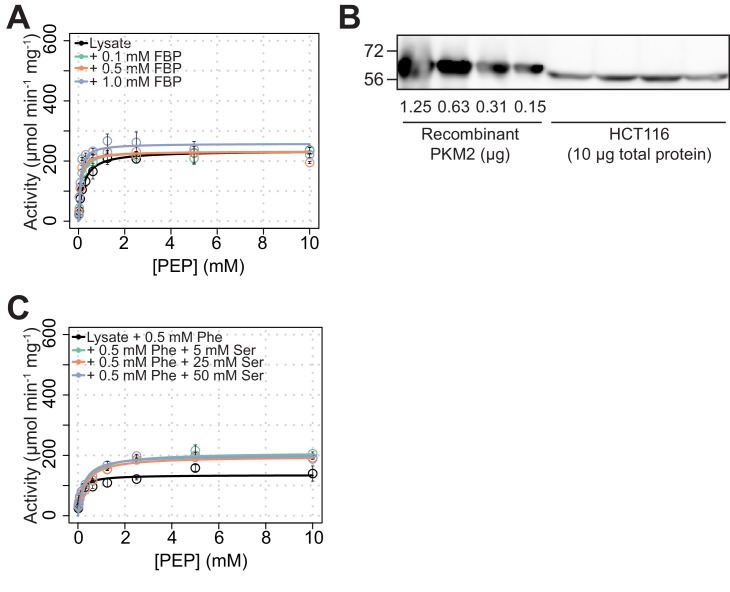
Figure 2—figure supplement 5. PKM2 activity in cell lysates can be significantly modulated by exogenous amino acids but not by FBP.

Figure 2—figure supplement 5.

(A) PKM2 activity as in Figure 2F but in lysates of HCT116 cells cultured in RPMI without glucose (Gluc-). (B) Quantification of PKM2 in HCT116 lysates. Western blot of recombinant PKM2 or HCT116 cell lysates (Gluc+ media) was probed with a PKM2 antibody. An interpolation of the linear fit of the band intensities of four amounts of recombinant PKM2 was used to estimate the amounts of PKM2 protein per 1 µg of total protein in HCT116 cell lysates, in order to determine specific activity in panels (A) and (C), and in Figure 2F and G. (C) PKM2 activity in HCT116 cell lysates as in Figure 2G but with 0.5 mM Phe and increasing amounts of Ser, as indicated.