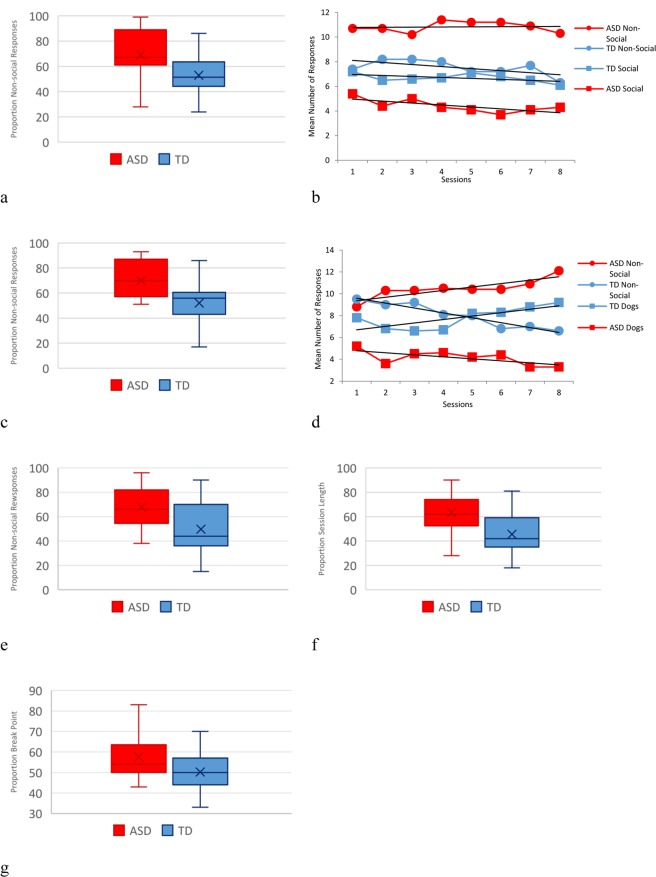
Figure 2.
(a) Box and whisker plot showing proportion of responding to non-social stimuli (geometric images) when presented with social human stimuli (adults’ faces) for ASD and TD children. (b) Mean number of responses per session for non-social (geometric images) and human social stimuli (adults’ faces). (c) Box and whisker plot showing proportion of responding to non-social stimuli (geometric images) when presented with social nonhuman stimuli (dogs’ faces) for ASD and TD children. (d) Mean number of responses per session for non-social (geometric images) and nonhuman social stimuli (dogs’ faces). (e) Box and whisker plot showing proportion of responding to non-social stimuli when social and nonsocial stimuli were presented in a single choice arrangement using a progressive ratio reinforcement schedule. (f) Proportion of responding to non-social (geometric images) when reinforcement strength during the progressive ratio schedule was measured as session length. (g) Preference for non-social stimuli when reinforcement strength during the progressive ratio schedule was measured as the schedule breakpoint.

