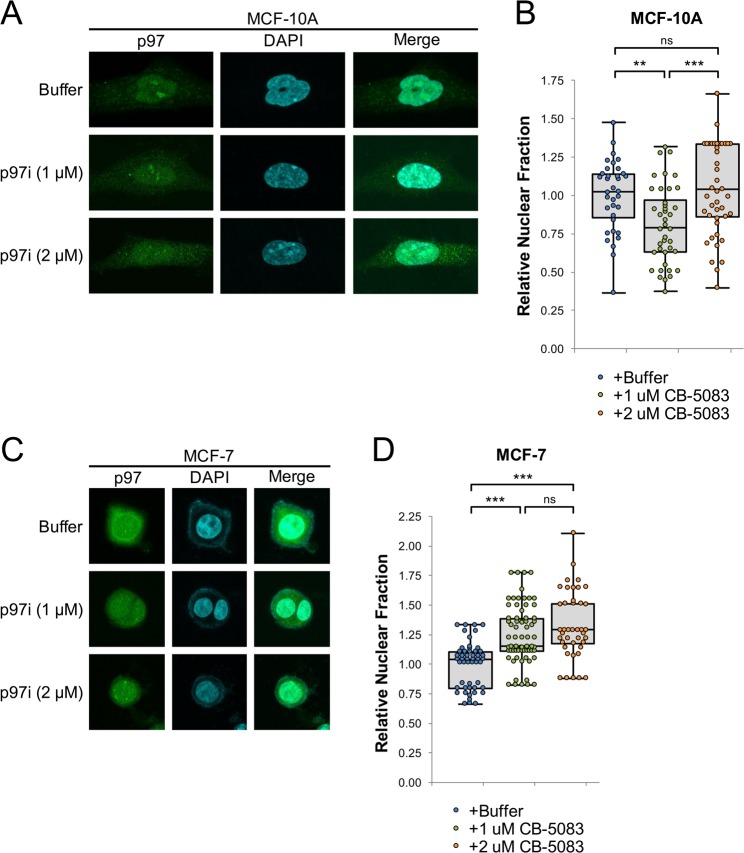
Figure 3.
Cellular localization of p97. (A) MCF-10A cells were plated for 24 hours and then treated with buffer or the indicated concentrations of CB-5083 (p97i). 24 hours after treatment, cells were visualized by immunofluorescence, with representative images shown (A). (B) Quantitation of relative nuclear abundance of p97 in (A), normalized to the mean in buffer-treated cells. (C,D) MCF-7 cells were treated, visualized (C), and quantitated (D), as in (A,B). Doses above 1.0 μM CB-5083 show elevated levels of the ER-associated stress and apoptosis marker CHOP (Fig. S4C). For each condition, three biological replicates were performed and a total of ≥40 cells were counted. Box plots are drawn from the first to third quartile and the median value is marked by a horizontal line. Whiskers extend to the minimum and maximum values. *p < 0.05, **p < 0.005, ***p < 0.0005, not significant (ns) p > 0.05.

