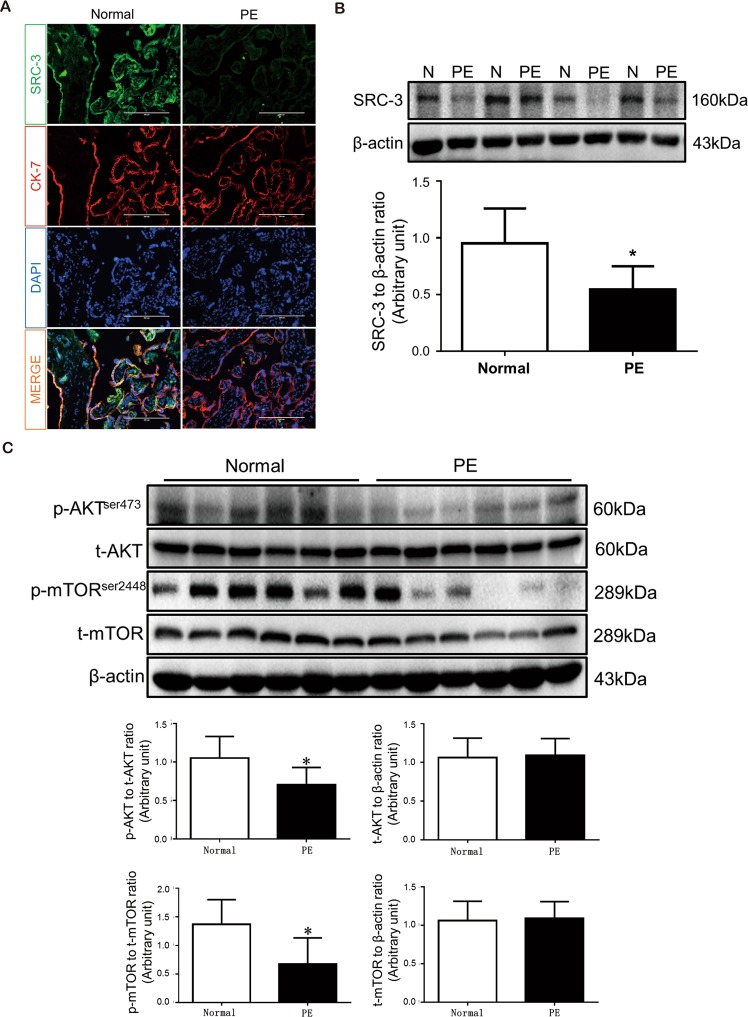
Figure 1.
SRC-3 expression pattern and AKT/mTOR signaling pathway component expression in normal and PE human placentas. (A) IF staining of SRC-3 (green) and CK7 (red) in frozen sections of human term-placentas; nuclei were counterstained by DAPI (blue). Scale bars: 200 μm. (B) Western blots of SRC-3 in human term-placentas, n = 5, *p < 0.05. (C) Western blots of AKT, p-AKT, mTOR, and p-mTOR protein expression in human term-placentas. β-actin served as a loading control, n = 6, *p < 0.05. All experiments were repeated at least three times.

