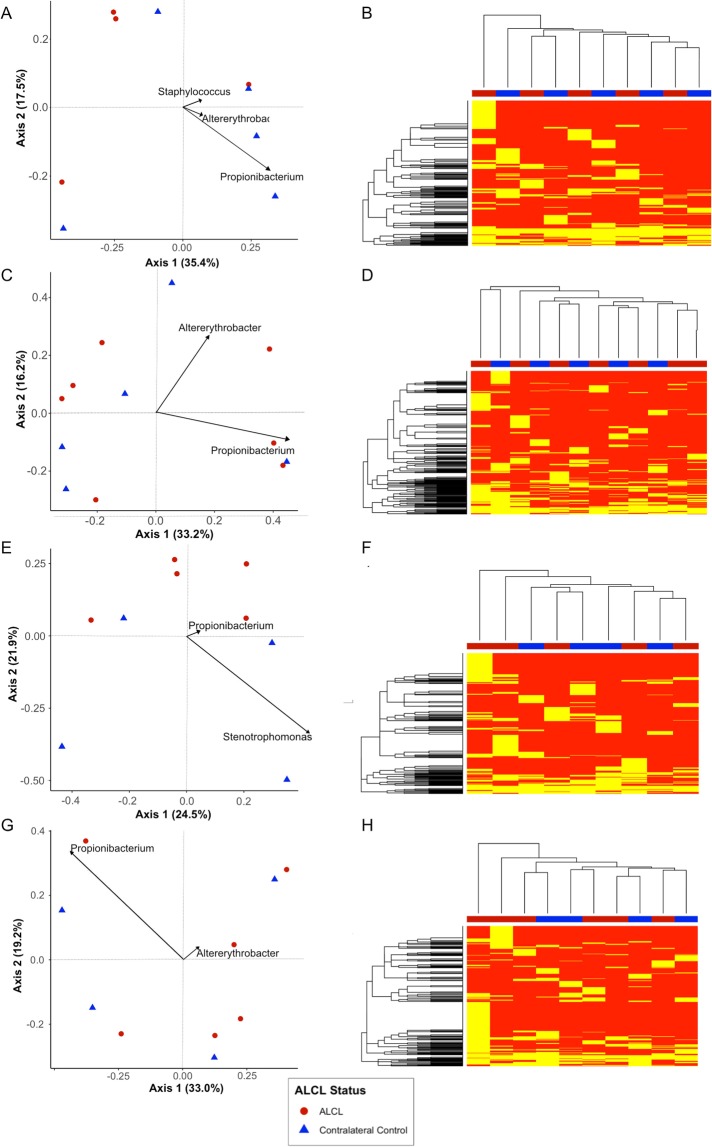
Figure 5.
Ordination and heat maps. Ordinations were created using the Bray-Curtis dissimilarity matrix and the top two sources of variability were plotted. Heatmap shows the presence and absence of a taxa as compared across all breast tissue samples. (A) Breast tissue ordinations. Overall variability of 52.9% was accounted for in axes 1 and 2. The primary drivers of variability in these samples were Propionibacterium, Staphylococcus, and Altererythrobacter. (B) Breast tissue samples (x-axis) are clustered by Euclidian distance, indicating there is not any specific clustering by taxonomic presence/absence. (C) Capsule ordinations. Overall variability of 49.4% was accounted for in axes 1 and 2. The primary drivers of variability in these samples were Propionibacterium and Altererythrobacter. (D) Capsule tissue samples (x-axis) are clustered by Euclidian distance, indicating there is not any specific clustering by taxonomic presence/absence. (E) Implant ordinations. Overall variability of 46.4% was accounted for in axes 1 and 2. The primary drivers of variability in these samples were Stenotrophomonas, and Propionibacterium. (F) Implant material samples (x-axis) are clustered by Euclidian distance, indicating there is not any specific clustering by taxonomic presence/absence. (G) Skin ordinations. Overall variability of 52.2% was accounted for in axes 1 and 2. The primary drivers of variability in these samples were Propionibacterium and Altererythrobacter. (H) Skin samples (x-axis) are clustered by Euclidian distance, indicating there is not any specific clustering by taxonomic presence/absence.

