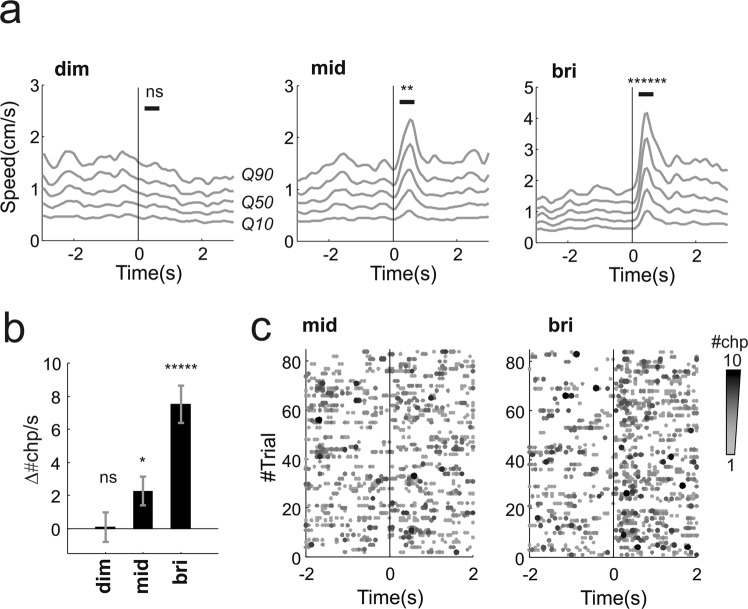
Figure 2.
Behavioural responses to full field flashes in visually intact animals. (a) Movement responses to dim, mid and bright flashes (respectively left, middle and right panels; visual stimulus at time 0). Each grey line represents a different quantile of the speed distribution (10th, 30th, 50th, 70th, 90th quantiles, respectively Q10 to Q90, averaged across the two cameras used to track behaviour, see also Fig. 1a–c and Methods). (b) Difference between changepoint rate after and before stimulus onset (calculated as Δ#chp/s = #chp/s (pre) - #chp/s (post), see Methods; the rates were calculated in time windows of 0.6 s). (c) Behavioural changepoints for individual trials for mid and bright flashes (respectively left and right panels). For both flashes we collected 84 trials (each trial here reported as row along the y-axis) from 12 animals (7 trials/animal). The flash was delivered at time 0). For a given trial the number of changepoints occurring at the same time frame are colour coded gray-to-black as exemplified in Fig. 1c (“pooled changepoints”). *p < 0.05, **p < 0.0.01, ***p < 0.005, ****p < 0.001, *****p < 0.0005, ******p < 0.0001, ns = not significant.

