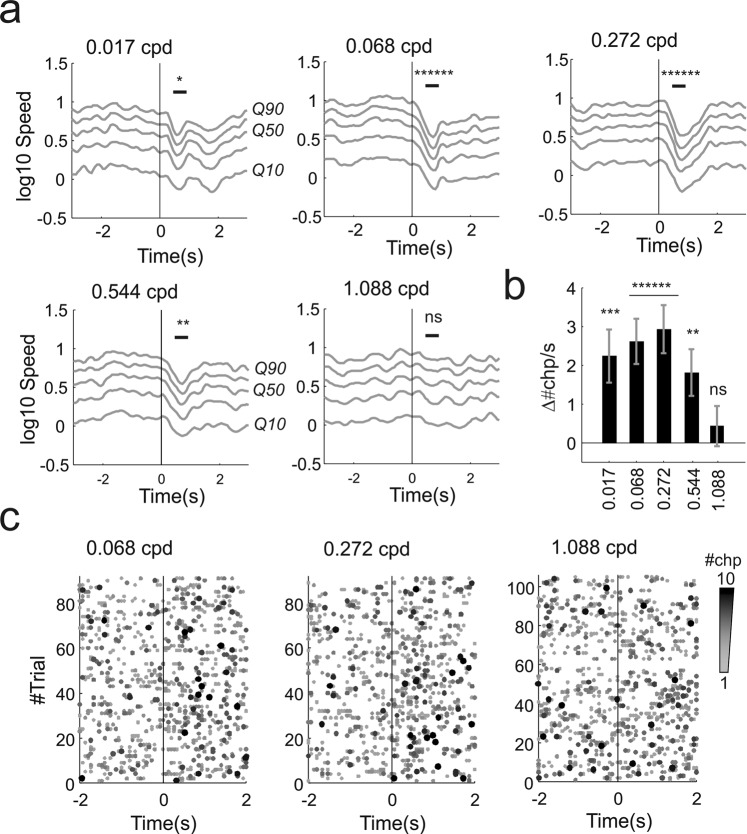
Figure 3.
Behavioural responses to looming + gratings in visually intact animals. (a) Movement responses (in log scale for 10th, 30th, 50th, 70th, 90th quantiles - respectively Q10 to Q90 - averaged across two cameras) to all spatial frequencies tested for the spatial acuity stimulus represented in Fig. 1d (the spatial frequency for each panel is indicated in cycles/degree in the top left corner of each panel; visual stimulus at time 0). Reduction in movement was significant for all frequencies apart from the highest (1.088 cycles/degree). (b) Differences in changepoint rate before and after stimulus onset across all spatial frequencies tested (mean ± sem; spatial frequencies are indicated as cycles/dregrees on the x-axis). (c) Behavioural changepoints for individual trials at different spatial frequencies (0.068, 0.272, 1.088 cycles/degree; 91, 91, 105 trials, 7 trials/animal; visual stimulus delivered at time 0). For a given trial the number of changepoints occurring at the same time frame are colour coded gray-to-black as exemplified in Fig. 1c (“pooled changepoints”). *p < 0.05, **p < 0.01, ***p < 0.005, ****p < 0.001, *****p < 0.0005, ******p < 0.0001, ns = not significant.

