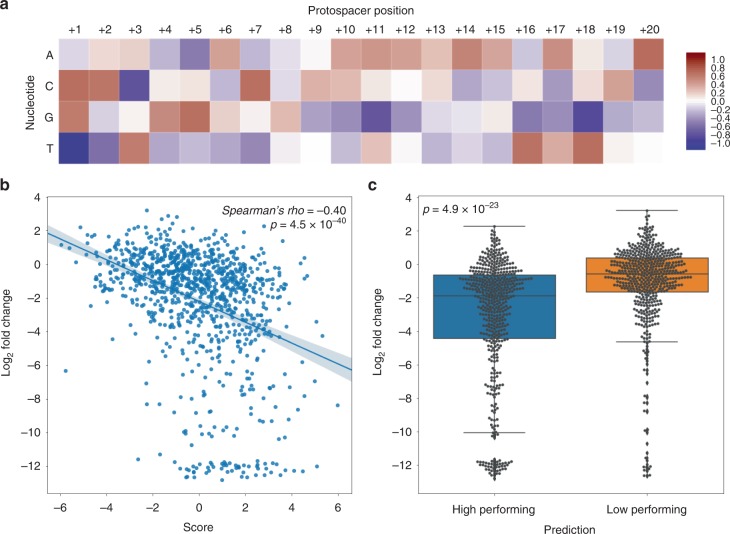
Fig. 2.
Sequence preference features of AsCpf1 a The scoring matrix for the prediction of AsCpf1 activity on endogenous loci. A positive value (in red tone) indicates a preference towards a nucleotide for a high-performing guide while negative value (in blue tone) indicates a preference against a high-performing guide. The position of the first nucleotide adjacent to PAM is defined as position +1 for the protospacer. b Correlation between AsCpf1 guide prediction scores and depletion levels of core-essential genes in the AsCpf1-based mono-cistronic library screenings. The predicted AsCpf1 guide scores for each guide in the validation set across 100 bootstrappings were plotted against their log2 transformed fold change in the screen (n = 342). Line of best fit is plotted and the shaded area is presented as s.d. c Box plot of predicted high-performing AsCpf1 guides (HighPerforming) and low-performing guides (LowPerforming) across 100 bootstrappings. Guides were defined as high-performing if predicting score >0 and low-performing if predicting score ≤0 (n = 342). Centerlines are present as medians. Bounds of boxes are present as first and third quantiles and whiskers are present as minimums and maximums without outliers. Source data are provided as a Source Data file

