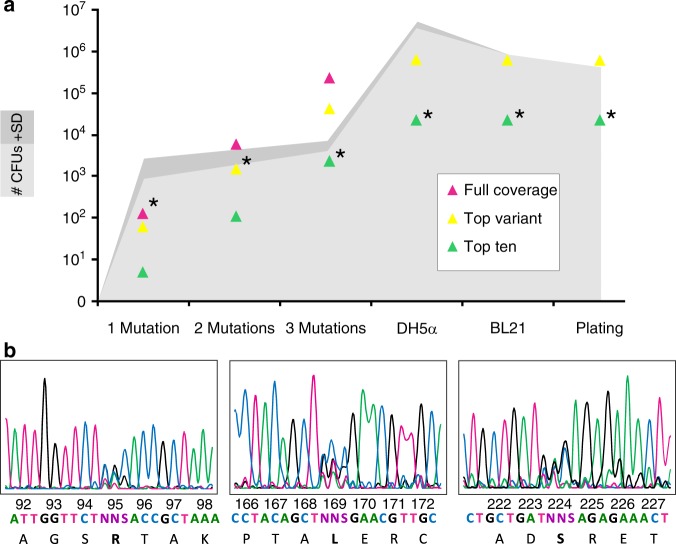
Fig. 4.
Generating the library. Mutations were introduced sequentially: R95 (1 mutation), R95 + L169 (2 mutations) and R95 + L169 + S224 (3 mutations). a Graphical representation of the bottlenecks in the experiment. As the library was assembled (one mutation to three mutations), more colony forming units (CFUs) are required to satisfactorily sample the full library diversity. Triangles represent the number of unique mutants present required for 95% probability of full-coverage (all possible protein mutants present), top-mutant (the best amino acid sequence present) and top-ten (one of the 10 best amino acid sequences present) in magenta, yellow, and green, respectively26. The upper (dark gray) and lower (light grey) 95% confidence interval values for number of CFUs show that by the end of library creation at least one of the top ten mutants was present (stars). This diversity was maintained through all cloning and selection steps. b The final library mix was sequenced and showed successful overlapping NNS peaks at amino acid positions 95, 169, and 224 (sample size: 1% of the total CFUs in each sample)

