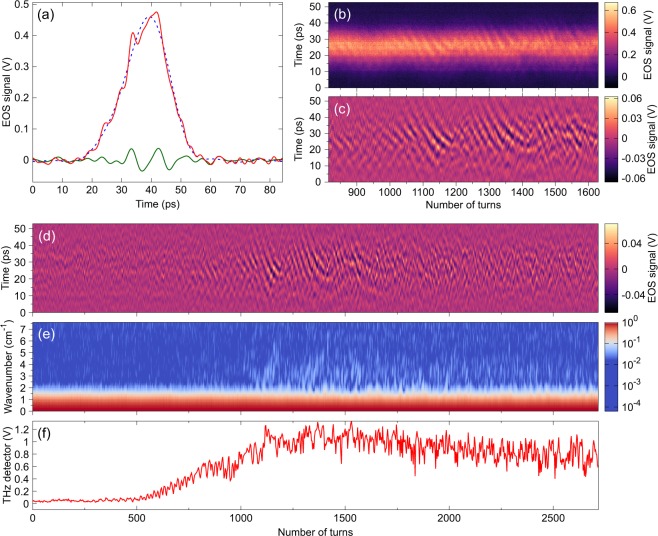
Figure 4.
Simultaneous recording of the electron bunch shape at each turn and associated emission of coherent synchrotron radiation (CSR). (a) Single-shot recording of an electron bunch shape that passes near the detection electro-optic crystal (electric near-field recorded using time-stretch electro-optic sampling). Red: electro-optic signal (over the 0–250 GHz bandwidth). Green: high frequency part between 90 and 250 GHz. Blue: low frequency part below 80 GHz. (b,c,d) Single-shot bunch shapes versus turns in the storage ring: (b) Total electro-optic sampling signal (unfiltered), (c) and (d): high frequency part (90–250 GHz) revealing the microbunching structure [(c) is a zoom of (d)]. (e) Power spectrum of each bunch shape versus turn number (the colormap has been normalized with respect to the global maximum). (f) Emitted coherent synchrotron radiation recorded simultaneously at the KARA infrared beamline using a THz diode detector (the pulse height is represented at each turn). Note the correlation between the increase in coherent synchrotron radiation emission in (f) and the spontaneous formation of microstructures (d,e).

