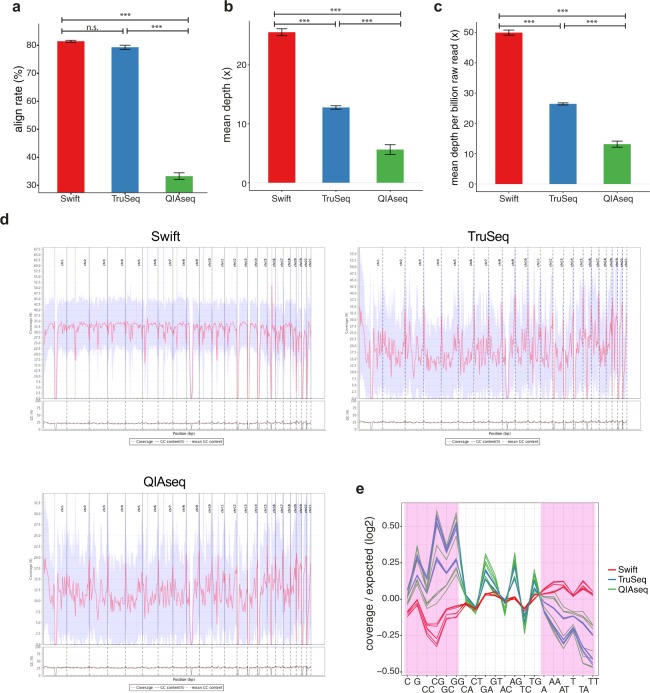
Figure 2.
Comparison of alignment rate, depth and nucleotide amplification bias across library preparation methods. (a) Alignment rate. (b) Effective sequencing depth. Depth was calculated based on mapped reads after read duplicates removal and with overlapping bases counted only once. (c) Average depth per billion raw read pairs, calculated as mean depth divided by corresponding library size. (d) Depth distribution (coverage) across the genome. One representative sample (Sample 1) was plotted for each of the three methods, with coverage from only autosomal regions displayed. The blue shaded area indicates the standard deviation of depth within each bin (n = 421). The genome was divided into a total of 421 bins according to default settings by qualimap. (e) Nucleotide amplification biases, expressed as the logarithm 2 transformed ratio of observed to expected coverage for different nucleotide and dinucleotide combinations. G/C-rich category (defined as C, G, CC, CG, GC and GG) and A/T-rich category (defined as A, AA, AT, T, TA and TT) are highlighted in pink. All libraries were sequenced on the HiSeq X platform. Each line represents one sample (library). n.s.: not statistically significant, P > 0.05, *P < 0.05, **P < 0.01, ***P < 0.001. Bars show average values, with error bars representing standard error of mean.

