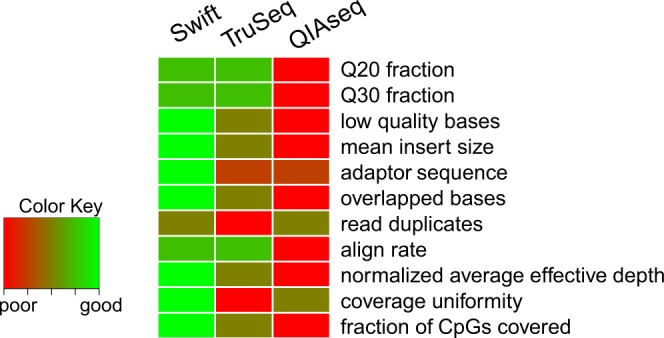
Figure 4.

Overall performance comparison between library preparation methods. Heatmap displaying rankings of the three library preparation methods by main performance metric. The libraries are ranked from one to three, with one (red) for the worst performing method and three (green) for the best performing method. Where there is no statistically significant difference between any pairwise comparison for a particular metric, the two methods will be given the same rank equivalent to the average ranks e.g. for Q20 fraction, QIAseq was the worst performing method (hence given a rank score of 1), while both Swift and TruSeq had the same rank score of 2.5 = (2 + 3)/2 since there was no statistically significant difference between the two.
