Figure 5.
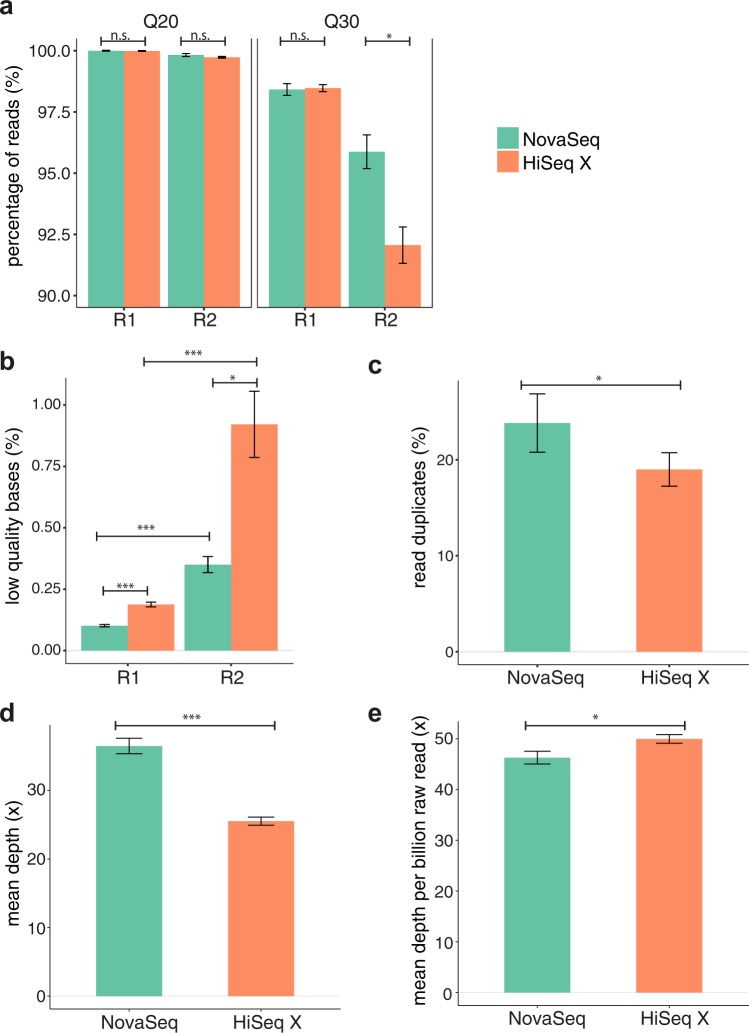
Comparison of quality metric for libraries sequenced on the NovaSeq and HiSeq X sequencing platforms. (a) Raw reads with sequencing quality > Q20 or > Q30. Values from Read 1 and Read 2 were analyzed separately. (b) Bases trimmed due to low quality (<Q20). (c) Read duplicates (read-pairs). Read duplicates were defined as two read-pairs with the same start and end positions. (d) Effective sequencing depth, calculated based on mapped reads after read duplicates removal, with overlapping bases counted only once. (e) Average depth per billion raw read pairs. All libraries were generated by the Swift library preparation kit. The same libraries were split into two and sequenced independently on NovaSeq 6000 and HiSeq X. n.s.: not statistically significant, P > 0.05, *P < 0.05, **P < 0.01, ***P < 0.001. Bars show average values, with error bars representing standard error of mean.

