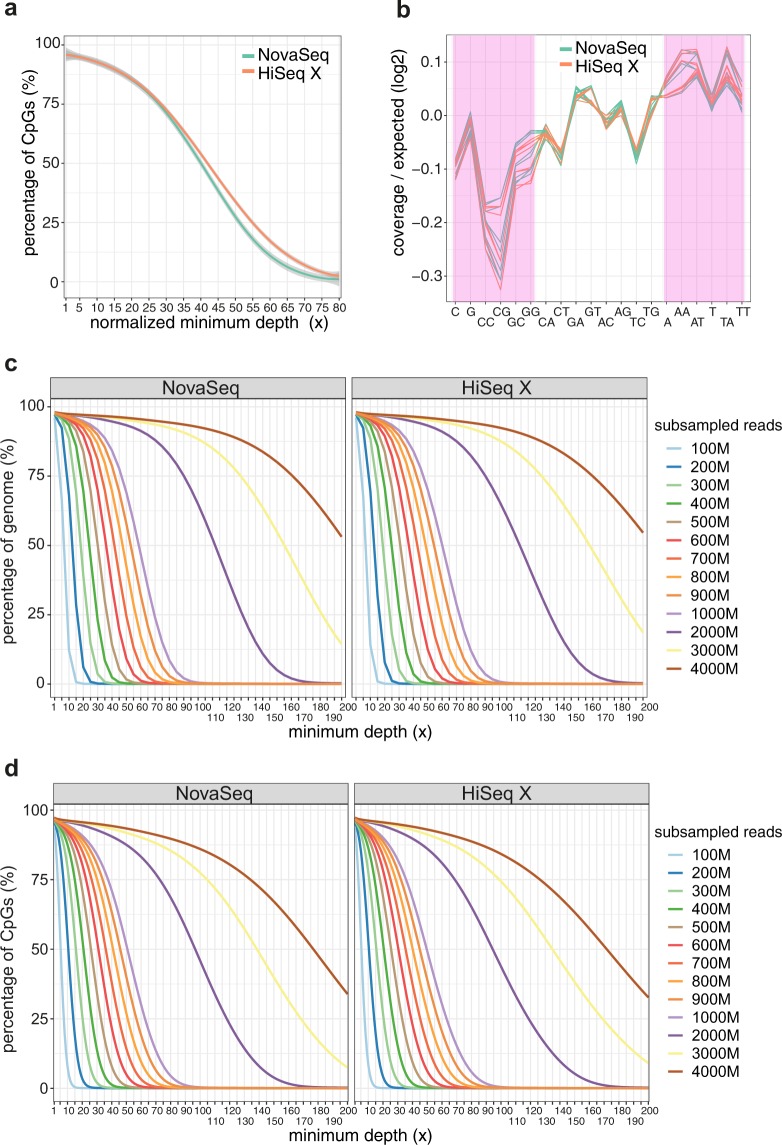
Figure 6.
Comparison of genome and CpG coverage at different minimum depths and nucleotide amplification bias between NovaSeq and HiSeq X sequencing platforms. (a) CpG site coverage at different minimum depths (1–80x). Loess smoothing was applied, with the 95% confidence intervals indicated by gray shaded areas. (b) Nucleotide amplification biases, expressed as the logarithm 2 transformed ratio of observed to expected coverage for different nucleotide and dinucleotide combinations. G/C-rich category (defined as C, G, CC, CG, GC and GG) and A/T-rich category (defined as A, AA, AT, T, TA and TT) are highlighted in pink. Each line represents one sample (library). (c) Genome coverage at each minimum depth across different number of raw read pairs. (d) CpG site coverage at each minimum depth across different number of raw read pairs. For c and d, results obtained from downsampling analyses are shown here for minimum depths ranging from 1–200x for library sizes consisting of 100–4000 M raw read pairs. All available samples were pooled for the downsampling analyses. n.s.: not statistically significant, P > 0.05, *P < 0.05, **P < 0.01, ***P < 0.001. Bars show average values, with error bars representing standard error of mean.

