Figure 7.
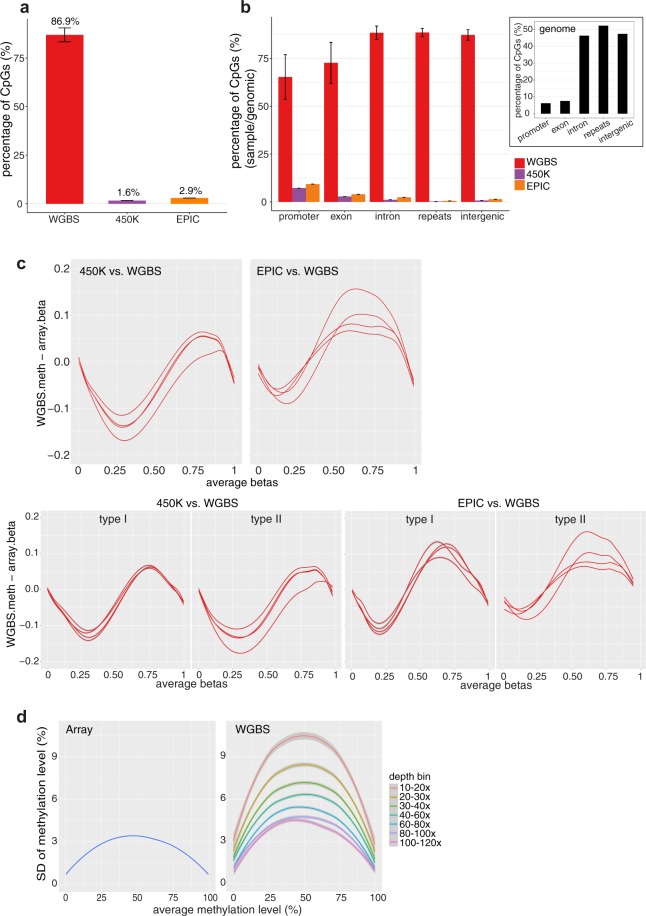
Comparison of performance between WGBS and methylation arrays on the HiSeq X sequencing platform. (a) CpG site coverage by WGBS and methylation arrays (450 K and EPIC). (b) CpG site coverage at different genomic features. The percentages were calculated by dividing the number of CpG sites covered with a minimum depth of 10x for each genomic feature by the total number of CpG sites in the genome for the corresponding genomic feature. Inset: Distribution of CpG sites in the genome by genomic features. Bars show average values, with error bars representing standard error of mean. (c) Bland-Altman plots comparing methylation levels reported by WGBS and the methylation arrays. Upper (all probe types): WGBS versus 450 K (left), WGBS versus EPIC (right). Lower (stratified by Type I and Type II probes): WGBS versus 450 K (left), WGBS versus EPIC (right). Each line represents one sample (library). (d) Comparison of standard deviation (SD) of methylation levels of replicate samples between WGBS and methylation arrays. CpG sites were binned according to their average coverage, inclusive of the lower limit and exclusive of the upper limit. For WGBS data, only CpG sites with a minimal depth of 10x were used across all analyses shown here. For c and d, only CpG sites found in both WGBS and array data are considered in the analyses. All WGBS data included in this analysis are generated by the Swift library preparation kit on the HiSeq X platform. For comparison of performance between WGBS and methylation arrays across all three library preparation methods on the HiSeq X platform, including TruSeq and QIAseq, see Supplementary Fig. 3a–d; Supplementary Table 11. For comparison of performance between WGBS and methylation arrays with the Swift method on both HiSeq X and NovaSeq platforms, see Supplementary Fig. 4a–d. n.s.: not statistically significant, P > 0.05, * P < 0.05, ** P < 0.01, ***P < 0.001.

