Fig. 2.
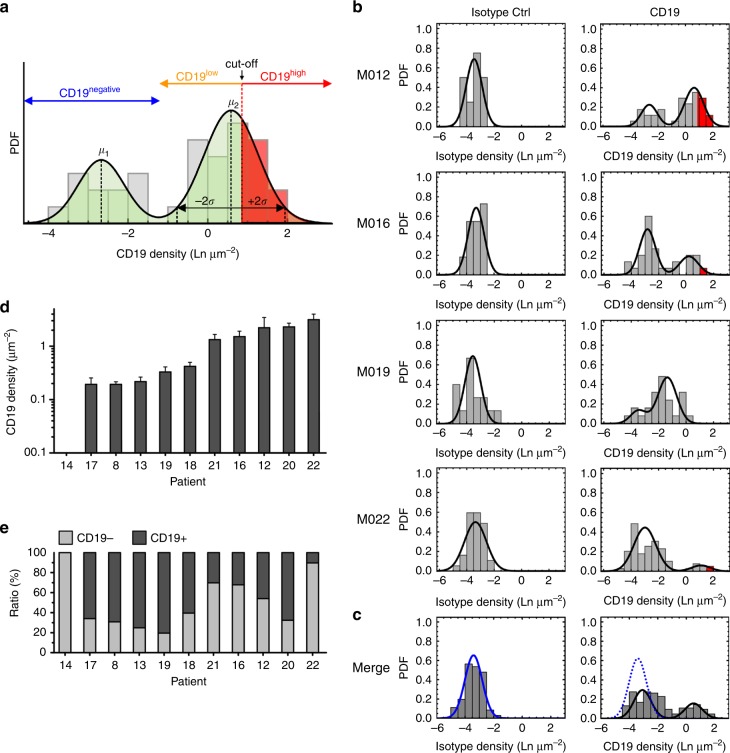
CD19 expression profiles on myeloma cells established by dSTORM. a Schematic expression profile of CD19. Density distributions were divided into a CD19-positive subpopulation (CD19-positive cells) and a CD19-negative subpopulation (CD19-negative cells; blue range). The latter group was defined by the density distribution pattern of the isotype control antibody (non-specific binding of the control antibody to the plasma membrane and glass surface). Distributions were fitted to a two-component log-normal function with mean (µ) and standard deviation (σ), to calculate density ranges from small (µ − 2σ) to large (µ + 2σ) values. The CD19-positive population was further divided into a CD19low (orange range) and a CD19high subpopulation (red range), based on the cutoff value of 1350 molecules per cell (see text for further details). b, c Expression profiles for CD19 on myeloma cells from patient M012, M016, M019, M022 and a merge c of these four patients generated by dSTORM. Distribution plots show the relative CD19 density obtained after staining with isotype control (left column) and anti-CD19 antibody (right column) on myeloma cells. Densities are provided as logarithmic numbers (natural logarithm, Ln) of molecules per µm2. Probability density functions (PDFs) were fitted with a one or two-component log-normal function that was dependent on the fit-accuracy calculated with an Anderson-Darling test (rejected at a p-value < 0.05). For each patient, the percentage of myeloma cells that had been determined to be CD19-positive by flow cytometry is provided for comparison (red segments). Dotted blue line in merge panel: function of the isotype control. Data for all patients are shown in Table 1 and Supplementary Fig. 4. d Mean CD19 molecule density on CD19-positive myeloma cells in molecules per µm2 as assessed by dSTORM imaging in n = 10 CD19-positive myeloma patients, and one CD19-negative patient (M014) for comparison. Error bars represent standard deviations of the means from repeated random sampling of the estimated log-normal distribution. e Percentages of CD19-positive and CD19-negative cells, ranging from 10% (M022) to 80% (M019) of CD19-positive cells among patients

