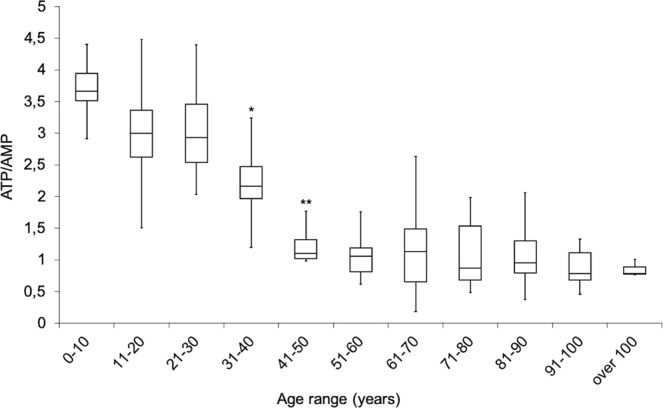
Figure 1.

Changes of MNC energy status during aging. Graph shows the ATP/AMP ratio, as a marker of the energy status of MNC isolated from peripheral blood (PB), obtained from healthy population with an age between 5 and 106 years. The population is divided by decades. The values decrease progressively with aging. * or ** indicate, respectively, a significant difference for p < 0.05 or p < 0.01 between the marked decade and the previous decade.
