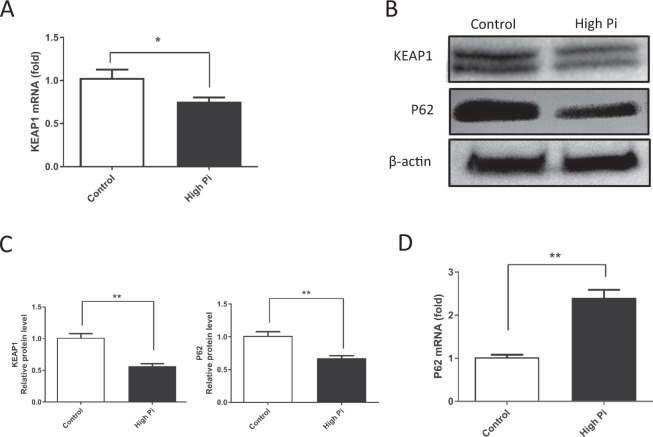
Figure 3.
Expression of KEAP1 and P62 during VSMC calcification induced by high Pi concentrations. (A,D) The expression of the KEAP1 (P = 0.0215) and the P62 mRNAs (P = 0.0049) was determined using real-time PCR (n = 4). (B) Protein extracts were prepared and analyzed by Western blot using anti-KEAP1, P62, and β-actin antibodies. (C) Quantitative data showing the KEAP1 (P = 0.0016) and P62 (P = 0.0022) levels. (n = 3, *P < 0.05, **P < 0.01, mean ± SD).

