Figure 3.
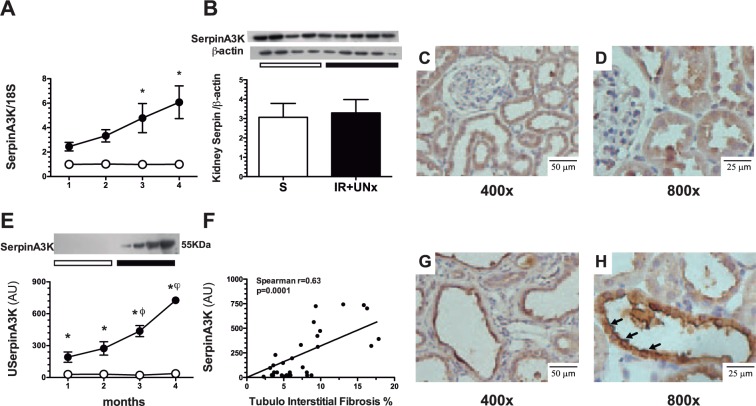
Timely AKI to CKD transition detection by serpinA3. (A) SerpinA3 mRNA levels in renal cortex during the follow-up of the animals, (B) SerpinA3 protein levels in the renal cortex evaluated by Western Blot 4 months post-ischemia, (C,D) representative microphotographs of serpinA3 immunostaining in renal cortex from the control group, magnification 400 and 800x respectively, (E) Urinary serpinA3 levels during AKI to CKD transition and compared with the control group, (F) Spearman correlation between urine serpinA3 and tubulo-interstitial fibrosis, and (G,H) representative microphotographs of serpinA3 immunostaining in renal cortex from the AKI to CKD transition group, magnification 400 and 800x respectively. Data are represented as mean ± SE. (for sham, n = 4, and for the AKI to CKD transition groups, n = 5 per period). White circles or bar represent sham and black circles or bar represent AKI to CKD transition groups and. *p < 0.05 vs. the sham group in their respective period, ϕp < 0.05 vs. IR + UNx 2nd month and ωp < 0.05 vs. IR + UNx 3rd month.

