Fig. 1.
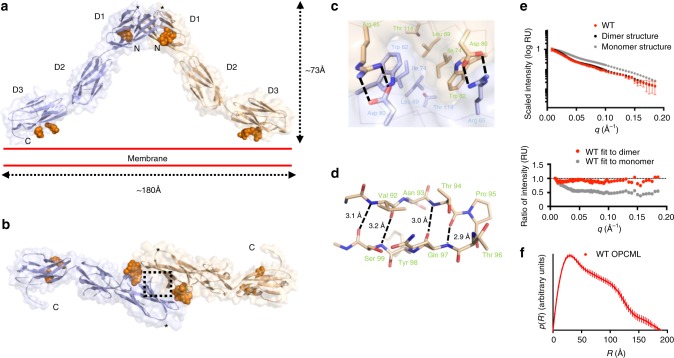
Crystal structure of the OPCML homodimer. a Ribbon representation overlaid on a transparent surface illustrating the dimeric architecture of OPCML. One monomer is colored blue and the other wheat. N-linked glycosylation (on asparagines 70, 293, and 306) are shown as orange spheres. Location of P95 indicated by asterisk. N- and C- termini are indicated. Red parallel lines show the relative orientation of OPCML to the plasma membrane (on the extracellular side). Scale bars are shown to illustrate maximum dimensions. b Represented the same as in a but viewed from the top. The dashed rectangle represents key residues at the dimerization interface and these are shown in detail in c. c The D1-D1 homodimerization interface. Arg 65 from one monomer forms a salt bridge with Asp of the other monomer. Below Arg 65 is a stacking interaction involving Trp 82, Ile 74, Leu 69, and Thr 114. Same color scheme as in a, b . The alpha carbon backbone is shown as thin lines. d Stick representation of the β-turn encompassing residue P95, shown in wheat. Residues 92–94 and 97–99 form part of the D and E β–strands, respectively. Hydrogen bonds are indicated by dashed lines. e Small angle X-ray scattering analysis of WT OPCML. Scattering curves were measured and compared to calculated data of the dimer as seen in the crystal structure and of a monomeric model of OPCML. The fit to the dimer (χ = 0.50) matches more closely than to the monomer (χ = 2.35). f Pair-distance distribution function curve for WT OPCML. The curve intercepts the x-axis at R = 189 Å, indicating the maximum atomic distance in a single scattering particle. This model-independent parameter is consistent with the maximum manually measured dimension of the dimer structure (~180 Å), and is significantly larger than the maximum dimension of the monomer structure (~124 Å)

