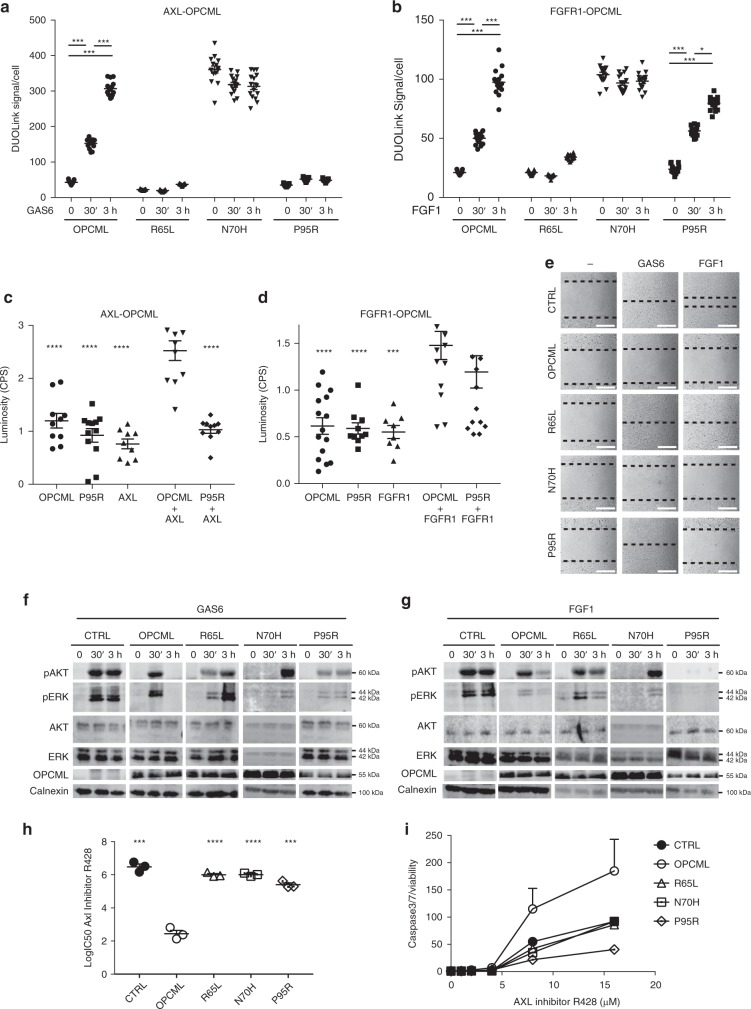
Fig. 4.
R65L, N70H, and P95R mutants interact differently with AXL and FGFR1. SKOV3 expressing an empty vector (CTRL), wild-type (OPCML) or mutant (R65L, N70H and P95R) OPCML were simulated for 30 min or 3 h with GAS6 (a) or FGF1 (b), and the interaction between OPCML and AXL (a) or OPCML and FGFR1 (b) was analyzed and quantified by Proximity Ligation Assay (DuoLink). The values from three independent experiments with five images each are shown all together. The bars indicate the mean ± s.e.m. Student t-test: *p < 0.05, ***p < 0.001. c, d Mammalian 2-hybrid assay. Cells were transfected with the indicated single constructs and the relative empty plasmids (not indicated), or with both plasmids expressing OPCML or P95R plus AXL (c) or plus FGFR1 (d). The bars indicate the mean ± s.e.m. calculated from the values of all the repeats from three independent experiments. Student t-test compared to wild-type OPCML plus AXL (c) or OPCML plus FGFR1 (d): ***p < 0.001, ****p < 0.0001. e Gap closure assay. SKOV3 cells expressing the indicated wild-type and mutant OPCML were serum starved and then left without stimulation (−) or stimulated with GAS6 or FGF1 as indicated. Migration was imaged after 15 h, and the migration front is highlighted by the dotted lines. Scale bar = 200 μm. f, g SKOV3 cells expressing the indicated wild-type and mutant OPCML were serum-starved and then stimulated with GAS6 (f) or FGF1 (g) for 30 min or 3 h. Cell lysates were analyzed by western blotting for the expression of total and phosphorylated AKT and ERK. Calnexin was used as loading control. h, i SKOV3 cells expressing the indicated wild-type and mutant OPCML were treated with the AXL inhibitor R428 for 2 days to assess the IC50 (h) or for 1 day to measure apoptosis (i). Student t-test compares CTRL and mutants to wild-type OPCML: ***p < 0.001, ****p < 0.0001. Both graphs show the mean ± s.e.m. of three independent experiments

