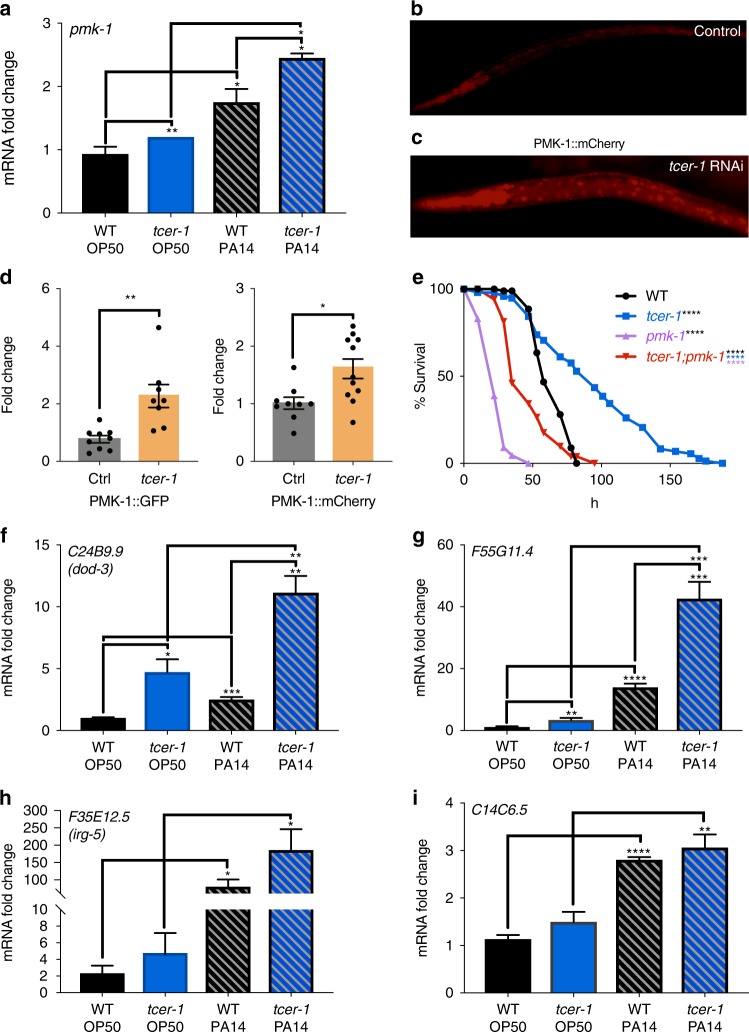
Fig. 5.
TCER-1 suppresses immunity by inhibiting PMK-1. a mRNA levels of pmk-1 measured by QPCR in day 1 wild-type (black) and tcer-1 mutant (blue) adults maintained on OP50 (solid bars) or exposed as L4s to PA14 for 8 h (hashed bars). b–d PMK-1::mCherry reporter strain grown on b empty control vector or c tcer-1 RNAi from egg until larval stage L4 then transferred to PA14 for 24 h. d PMK-1::mCherry quantification from (c) and similar imaging of PMK-1::GFP strain upon tcer-1 RNAi. Data combined from three biological replicates with 15–20 animals imaged per strain per replicate. e pmk-1 null mutation suppresses tcer-1 mutant’s PA14 resistance. Survival of wild-type animals (WT, black m = 63.49 ± 1.3, n = 75/100), tcer-1 (blue, m = 93.82 ± 4.4, n = 84/100, P vs. WT <0.0001), pmk-1 (m = 23.77 h ± 0.8, n = 92/100, P vs. WT <0.001) and tcer-1;pmk-1 mutants (m = 45.95 ± 1.8, n = 97/102, P vs. tcer-1 <0.001, P vs. pmk-1 <0.0001, P vs. WT <0.0001) on PA14 after development on OP50 till L4 stage. f–i Expression of PMK-1 target genes is upregulated in tcer-1 mutants. Q-PCR analysis of mRNA levels of known PMK-1-upregulated genes f dod-3, g F55G11.4, h irg-5 and i C14C6.5 measured after wild-type (WT, black) and tcer-1 mutants (blue) grown on OP50 till L4 stage were transferred to PA14 plates for 12 h (hashed bars) or continued on OP50 (solid bars). Data in (a) and (f–i) combined from three independent biological replicates, each including three technical replicates. Error bars represent standard error of the mean (SEM). Survival data in panel (e) calculated using the Kaplan−Meier test and shown as mean lifespan in hours (m) ± SEM (see Methods for details). In (a, d and f–i) statistical significances were calculated using a one-tailed t test. P values were adjusted for multiplicity where applicable. Asterisks indicate the degree of statistical significance <0.05 (*), <0.01 (**), <0.001 (***) and <0.0001 (****) and their color denotes the strain/condition of comparison

