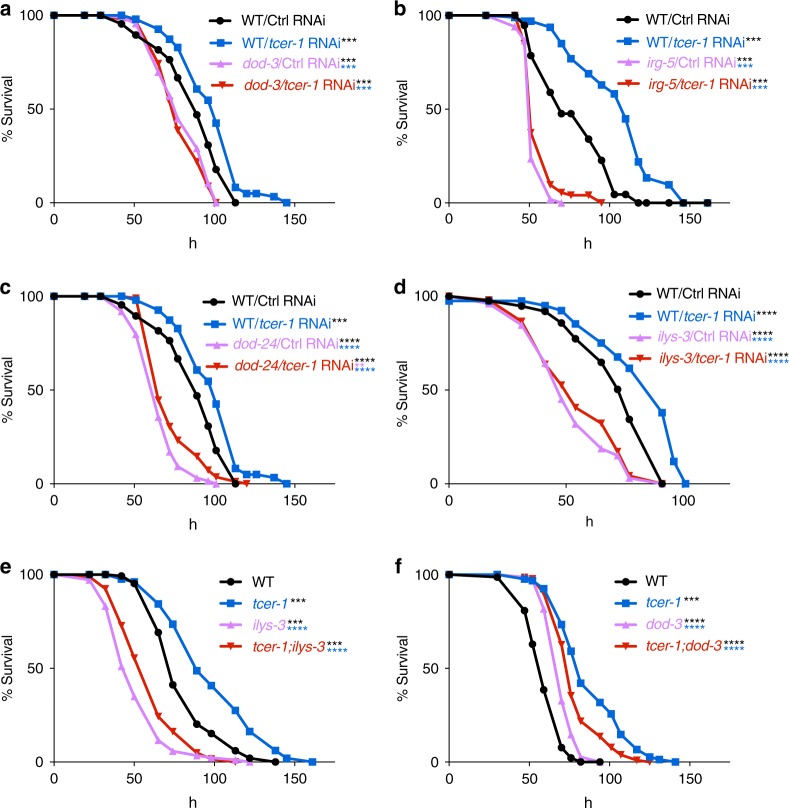
Fig. 7.
TCER-1-repressed genes are essential for resistance against PA14. Survival of wild-type L4 animals grown from egg stage on empty control vector (black, WT/Ctrl) or tcer-1 RNAi bacteria (blue, WT/tcer-1) and then transferred to PA14 plates compared to the survival of a dod-3, b irg-5, c dod-24 or d ilys-3 mutants grown on empty control vector (pink curves) or tcer-1 RNAi bacteria (red). a WT/Ctrl (m = 87.63 ± 2.2), WT/tcer-1 (m = 99.27 ± 2.1), dod-3/Ctrl (m = 79.95 ± 1.5), dod-3/tcer-1 (m = 78.8 ± 1.4). b WT/Ctrl (m = 77.67 ± 3.0), WT/tcer-1 (m = 104.62 ± 2.7), irg-5/Ctrl (m = 53.07 ± 0.7), irg-5/tcer-1 (m = 56.69 ± 1.2). c WT/Ctrl (m = 87.63 ± 2.2), WT/tcer-1 (m = 99.27 ± 2.1), dod-24/Ctrl (m = 66.18 ± 1.4), dod-24/tcer-1 (m = 74.20 ± 1.5). d WT/Ctrl (m = 72.12 ± 2.3), WT/tcer-1 (m = 81.33 ± 2.5), ilys-3/Ctrl (m = 52.15 ± 1.9), ilys-3/tcer-1 (m = 55.21 ± 2.0). e Survival of wild type and mutants transferred to PA14 plates at L4 stage. WT (black, m = 88.05 ± 2.0), tcer-1 (blue, m = 111.81 ± 2.3), ilys-3 (pink, m = 54.29 ± 1.3) and tcer-1;ilys-3 (m = 60.74 ± 1.5). f WT (m = 60.06 ± 0.8), tcer-1 (m = 87.9 ± 2.0), dod-3 (m = 70.87 ± 0.75) and tcer-1;dod-3 (m = 79.06 ± 1.3). Survival estimated using the Kaplan−Meier analysis and shown as mean lifespan in hours (m) ± standard error of the mean (SEM). P values were adjusted for multiplicity where applicable. Asterisks indicate statistical significance <0.01 (**), <0.001 (***) and <0.0001 (****) and their color denotes the strain of comparison. Assays in panels (a) and (c) were performed in the same biological replicate so their controls are shared. Details of number of animals and data from additional trials are presented in Supplementary Table 6

