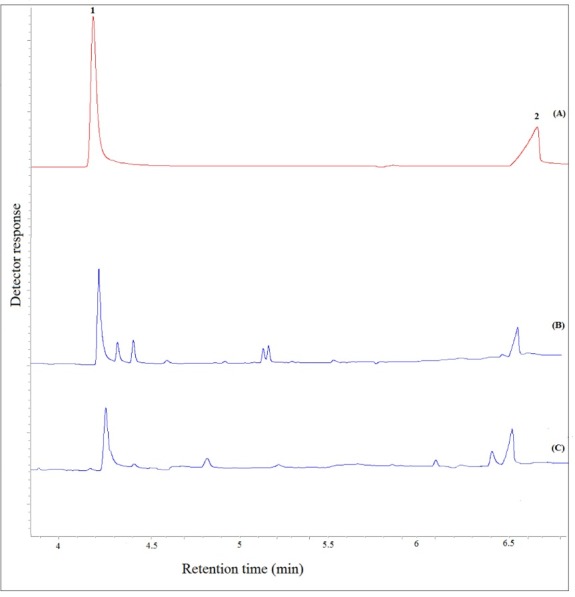
Fig. 7.

Typical GC–FID chromatograms of: (A) a standard solution prepared in chloroform (250 mg L−1, each analyte), (B) plasma sample spiked with the analytes at a concentration of 8 mg L-1 (each analyte), and (C) patient plasma after performing the proposed method, except for chromatogram (A) in which direct injection was used. Peaks identification: 1, 3-Heptanone; and 2, VPA.
