Figure 1.

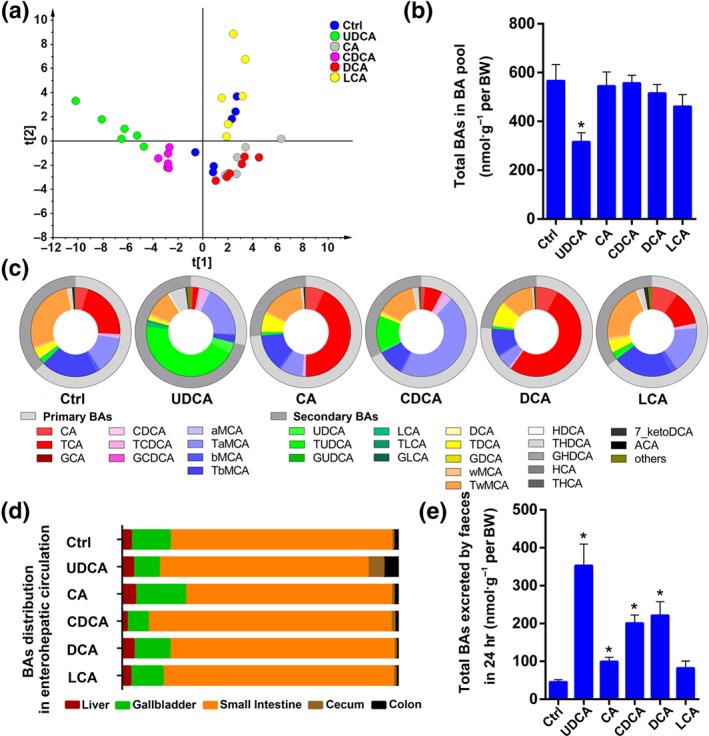
UDCA has a distinct effect on bile acid pool. (a) The multivariate analysis model (PLS‐DA) based on the bile acid profile of the bile acid pool shows that groups of mice that were administered different bile acids were clearly separated, especially the UDCA and DCA group (n = 6 per group). (b) The total concentration of BAs per body weight in the BA pool was shown to be different depending on specific BA supplementation; 44 bile acids were detected and quantitated in different organs and tissues. The BA pool is equal to the sum of the total bile acids in liver, gall bladder, small intestine, caecum, colon, and serum (n = 6 per group). (c) The bile acid composition of bile acid pool. The outside circle shows the proportion of primary and secondary bile acids in the bile acid pool. The inner circle shows 28 individual bile acid proportions and the sum of 16 low content bile acid proportions of the bile acid pool (n = 6 per group). (d) The bile acid distribution of the bile acid pool in the enterohepatic circulation (n = 6 per group). (e) The amount of BA excreted in faeces within 24 hr (n = 6 per group). Mean values ± SEM are expressed for the bar chart. *P < .05 versus normal control group
