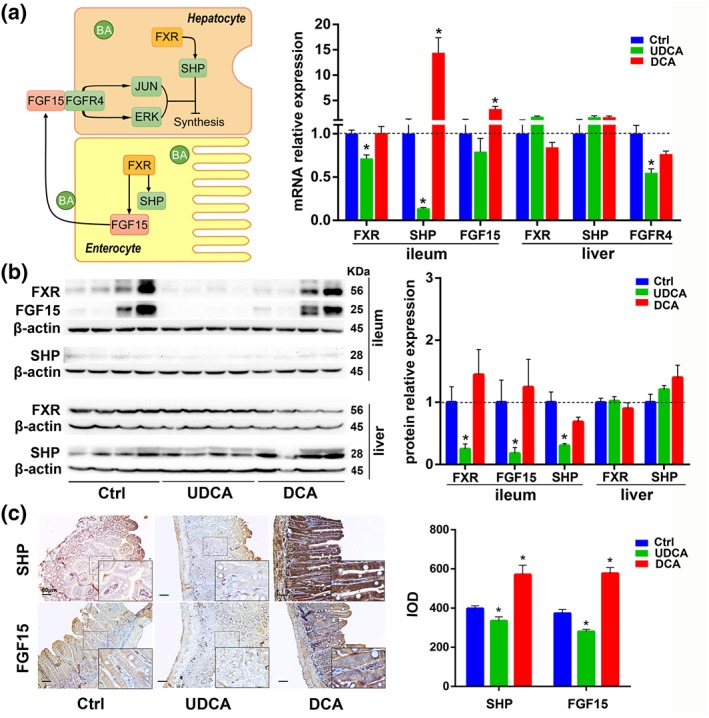
Figure 5.

The influence of UDCA on the FXR signalling pathway in vivo. (a) Diagram and mRNA analysis of FXR signalling pathway components in the ileum and liver (n = 6 per group). (b) Protein expression levels of FXR signal pathway components in the ileum and liver and densities of protein levels relative to β‐actin shown as fold change relative to control group (n = 6 per group). (c) Representative pictures of immunohistochemistry staining of FXR signal pathway components in the ileum and integrated option density shown as a bar chart (n = 6 per group). Data are mean values ± SEM. *P < .05 versus normal control group
