Figure 3.
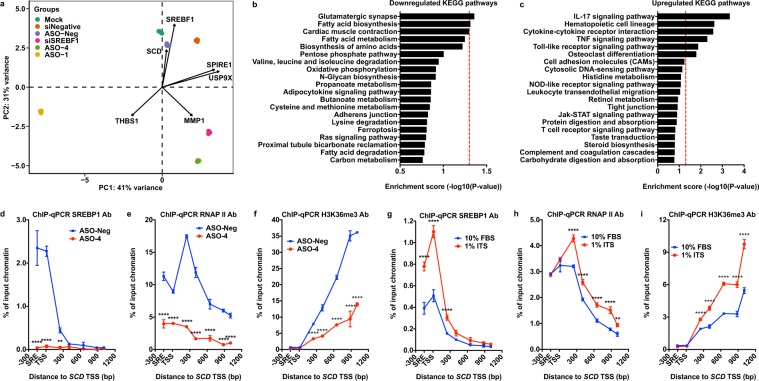
SREBP1 regulates DNFA pathway genes through RNAP II recruitment and productive elongation. (a) mRNAs of HT-144 cells were sequenced after ASOs (5 nM) or pooled siRNAs (50 nM) treatment in 1% ITS medium for three days. RNA-Seq data were analyzed with DESeq2 and principal component analysis (PCA). (b,c) The top 20 enriched signaling and metabolic KEGG pathways were discovered from differentially expressed genes (siSREBF1 group vs siNegative group) in RNA-Seq analysis using Generally Applicable Gene-set Enrichment (GAGE) method106. Red dash line marks P value = 0.05. (d–f) HT-144 cells were transfected with ASO-4 (5 nM) or the negative control ASO (5 nM), cultured in 1% ITS medium. Percentage of input DNA was compared between two treatments for the indicated antibodies at the 5′ promoter region of the SCD gene. (g–i) ChIP-qPCR analyses detected DNA pulldown using indicated antibodies at the SCD gene in HT-144 cells. ChIP-qPCR signals were compared between cells cultured in 10% FBS and 1% ITS medium conditions. Data were presented as mean ± SD and quantified from triplicates. Two-way ANOVA tests were performed. ns, not significant; *P < 0.05; **P < 0.01; ***P < 0.001; ****P < 0.0001.

