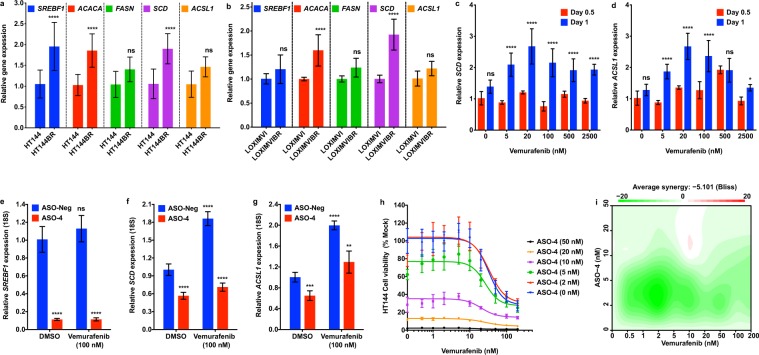
Figure 6.
Elevated DNFA expression accompanies drug resistance in BRAFi treated melanoma cells. (a) RT-qPCR assay compared the DNFA gene expression between HT-144 cells in 10% FBS medium and HT-144BR cells in 10% FBS medium with vemurafenib (2 μM). (b) RT-qPCR assay compared the DNFA gene expression between LOXIMVI cells in 10% FBS medium and LOXIMVIBR cells in 10% FBS medium with vemurafenib (2 μM). (c,d) HT-144 cells were treated with different dosages of vemurafenib for 0.5 or 1 day in 1% ITS medium. SCD expression was assayed by RT-qPCR analysis. Expression of SCD from all treatment groups was normalized to expression under DMSO treatment at day 0.5 (normalized as 1). Relative gene expression was compared between 0.5-day and 1-day treatment groups. Data were presented as mean ± SD and quantified from triplicates. Two-way ANOVA tests were performed. *P < 0.05; **P < 0.01; ***P < 0.001; ****P < 0.0001. (e–g) HT-144 cells were transfected with ASO-4 (5 nM) and then treated with vemurafenib (100 nM) in 1% ITS medium for one day. RT-qPCR assay analyzed DNFA gene expression from treatment groups relative to expression under ASO-Neg and DMSO treatment at day 1 (normalized as 1). Data are presented as mean ± SD and quantified from triplicates. One-way ANOVA tests were performed. ns, not significant; *P < 0.05; **P < 0.01; ***P < 0.001; ****P < 0.0001. (h) HT-144 cells were transfected with ASO-4, and then treated in combination with vemurafenib. Cell viability was measured by cell titer-glo assay three days after combined treatment in 1% ITS medium. (i) The drug interaction in (h) was evaluated with the Bliss independence model.

