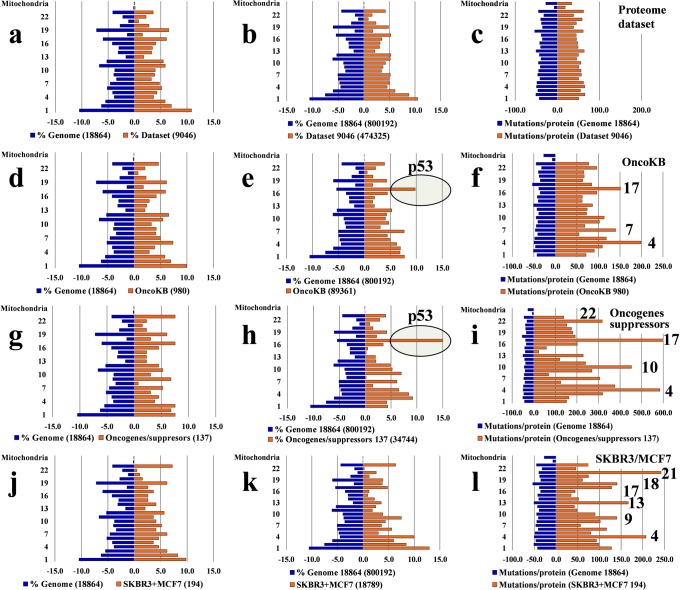
Figure 2.
Comparison of chromosomal distributions of missense mutations in various datasets to the human genome. The left panels (blue) represent mutations in the human genome (18,864 genes), and the right panels (orange) represent mutations in various protein or gene datasets. Comparisons to the human genome are provided for: (a–c) an aggregate list of 9,046 genes coding for proteins detected in the proteome profile of MCF7, MCF10 and SKBR3 cells; (d–f) the list of 980 genes in the OncoKB database33; (g–i) the list of 137 oncogenes and tumor suppressors proposed in ref.1. (j–l) the list of 194 mutated proteins detected in SKBR3 and MCF7 cells. The 1st column of histograms represents the % distribution of genes or proteins per chromosome in the human genome and in the various datasets; the 2nd column represents the % distribution of missense mutations per chromosome in the human genome and in various datasets; the 3rd column represents the distribution of the total number of mutations per gene or protein and per chromosome. The numbers of genes or proteins for each dataset are provided for each panel, and the 2nd column provides the total mutation counts per dataset, as well. All mutation counts represent the catalogued values for the existing genes in the mutation database that was used in this study.

