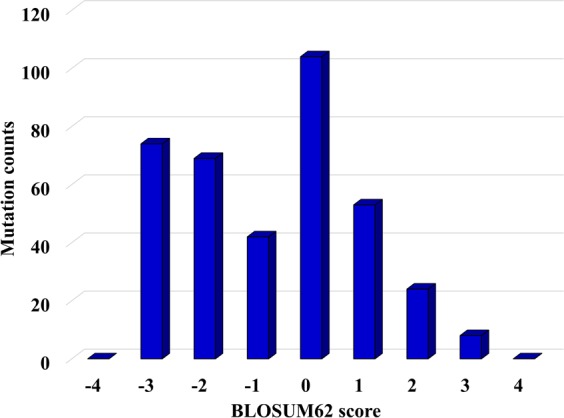
Figure 3.

Column chart representing BLOSUM62 scores associated with the observed amino acid substitutions. The scores were assigned based on the BLOSUM62 substitution matrix and reflect the frequency of amino acid substitutions in conserved regions of protein families. More negative scores reflect less likely substitutions, while more positive scores reflect more likely substitutions. For scores close to zero, the observed frequency of a substitution approaches the expected value.
