. 2016 Apr 9;33(4):281–286. doi: 10.5511/plantbiotechnology.16.0218a

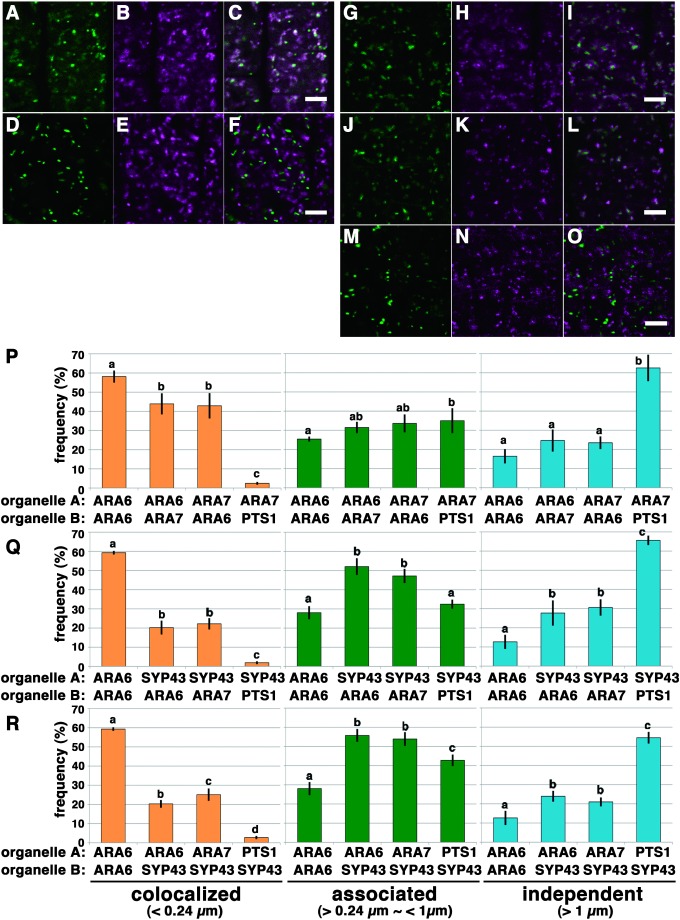
Figure 2. Quantitative analysis of the localization pattern of two distinctive RAB5 endosomes and SYP43-localizing TGN in root epidermal cells near meristematic regions of A. thaliana. (A–C) Distribution of ARA6-GFP (A, green) and mRFP-ARA7 (B, magenta). (C) Merged image of (A) and (B). Scale bar=5 µm. (D–F) Distribution of peroxisomes (GFP-PTS1) (D, green) and mRFP-ARA7 (E, magenta). (F) Merged image of (D) and (E). Scale bar=5 µm. (G–I) Distribution of the TGN compartments labeled by GFP-SYP43 (G, green) and MVEs labeled by ARA6-mRFP (H, magenta). (I) Merged image of (G) and (H). Scale bars=5 µm. (J–L) Distribution of the TGN compartments labeled by GFP-SYP43 (J, green) and MVEs labeled by mRFP-ARA7 (K, magenta). (L) Merged image of (J) and (K). Scale bars=5 µm. (M–O) Distribution of the peroxisomes labeled by GFP-PTS1 (M, green) and the TGN compartments labeled by mRFP-SYP43 (N, magenta). (O) Merged image of (M) and (N). Scale bars=5 µm. (P) Bar graphs representing the localization relationships of ARA6/ARA7 and ARA7/PTS1. The frequency of colocalization for ARA6/ARA7 was significantly lower than for ARA6/ARA6, indicating that ARA6 and ARA7 only partially overlap with each other (p<0.05 by Tukey’s test). Localization frequency of ARA6/ARA6 shown in Figure 1G is represented here as the positive control. Error bars indicate±standard deviation. (Q) Bar graph representing the localization of the TGN in relation to ARA6, ARA7 and peroxisomes. The distances from the center of each SYP43 spot to the center of the closest marker spot (ARA6, ARA7 or PTS1) were classified. The graph indicates that the majority of the population of SYP43 foci was classified as “associated” with ARA6 or ARA7 foci (middle graph). A subpopulation of SYP43 was classified as “colocalized” with ARA6 or ARA7 (left graph) (p<0.05 by Tukey’s test). Localization frequency of ARA6/ARA6 shown in Figure 1G is represented here as the positive control. Error bars indicate±standard deviation. (R) Bar graph representing the localization of ARA6, ARA7 and peroxisomes in relation to the TGN. The distances from the center of each marker (either ARA6, ARA7 or PTS1) to the center of the closest SYP43 spot were classified (p<0.05 by Tukey’s test). Similarly to the result in Figure 2Q, the majority of the populations of ARA6 and ARA7 foci were classified as “associated” with SYP43 foci (middle graph). Subpopulations of ARA6 and ARA7 were classified as “colocalized” with SYP43 (left graph). The frequency of the colocalization of ARA7/SYP43 pairs was significantly higher than for ARA6/SYP43 pairs (p<0.05 by Tukey’s test). Localization frequency of ARA6/ARA6 shown in Figure 1G is represented here as the positive control. Error bars indicate±standard deviation.

Figure 2. Quantitative analysis of the localization pattern of two distinctive RAB5 endosomes and SYP43-localizing TGN in root epidermal cells near meristematic regions of A. thaliana. (A–C) Distribution of ARA6-GFP (A, green) and mRFP-ARA7 (B, magenta). (C) Merged image of (A) and (B). Scale bar=5 µm. (D–F) Distribution of peroxisomes (GFP-PTS1) (D, green) and mRFP-ARA7 (E, magenta). (F) Merged image of (D) and (E). Scale bar=5 µm. (G–I) Distribution of the TGN compartments labeled by GFP-SYP43 (G, green) and MVEs labeled by ARA6-mRFP (H, magenta). (I) Merged image of (G) and (H). Scale bars=5 µm. (J–L) Distribution of the TGN compartments labeled by GFP-SYP43 (J, green) and MVEs labeled by mRFP-ARA7 (K, magenta). (L) Merged image of (J) and (K). Scale bars=5 µm. (M–O) Distribution of the peroxisomes labeled by GFP-PTS1 (M, green) and the TGN compartments labeled by mRFP-SYP43 (N, magenta). (O) Merged image of (M) and (N). Scale bars=5 µm. (P) Bar graphs representing the localization relationships of ARA6/ARA7 and ARA7/PTS1. The frequency of colocalization for ARA6/ARA7 was significantly lower than for ARA6/ARA6, indicating that ARA6 and ARA7 only partially overlap with each other (p<0.05 by Tukey’s test). Localization frequency of ARA6/ARA6 shown in Figure 1G is represented here as the positive control. Error bars indicate±standard deviation. (Q) Bar graph representing the localization of the TGN in relation to ARA6, ARA7 and peroxisomes. The distances from the center of each SYP43 spot to the center of the closest marker spot (ARA6, ARA7 or PTS1) were classified. The graph indicates that the majority of the population of SYP43 foci was classified as “associated” with ARA6 or ARA7 foci (middle graph). A subpopulation of SYP43 was classified as “colocalized” with ARA6 or ARA7 (left graph) (p<0.05 by Tukey’s test). Localization frequency of ARA6/ARA6 shown in Figure 1G is represented here as the positive control. Error bars indicate±standard deviation. (R) Bar graph representing the localization of ARA6, ARA7 and peroxisomes in relation to the TGN. The distances from the center of each marker (either ARA6, ARA7 or PTS1) to the center of the closest SYP43 spot were classified (p<0.05 by Tukey’s test). Similarly to the result in Figure 2Q, the majority of the populations of ARA6 and ARA7 foci were classified as “associated” with SYP43 foci (middle graph). Subpopulations of ARA6 and ARA7 were classified as “colocalized” with SYP43 (left graph). The frequency of the colocalization of ARA7/SYP43 pairs was significantly higher than for ARA6/SYP43 pairs (p<0.05 by Tukey’s test). Localization frequency of ARA6/ARA6 shown in Figure 1G is represented here as the positive control. Error bars indicate±standard deviation.